| 2025-11-22 08:10:00+08:00 |
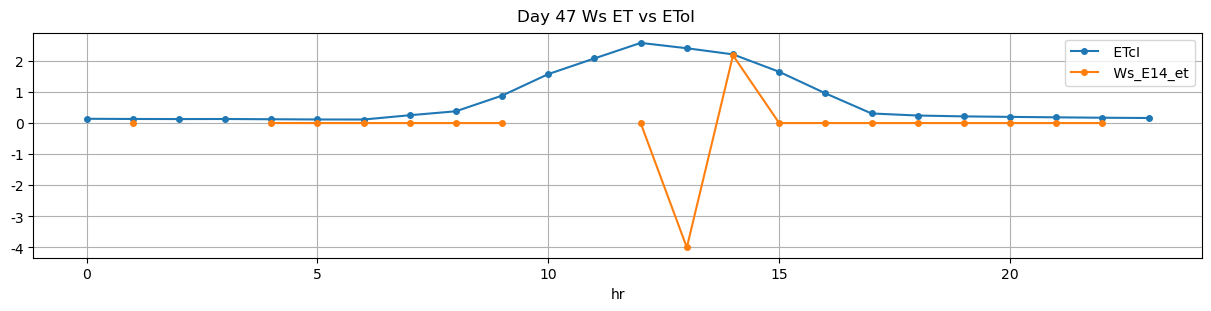
47 |
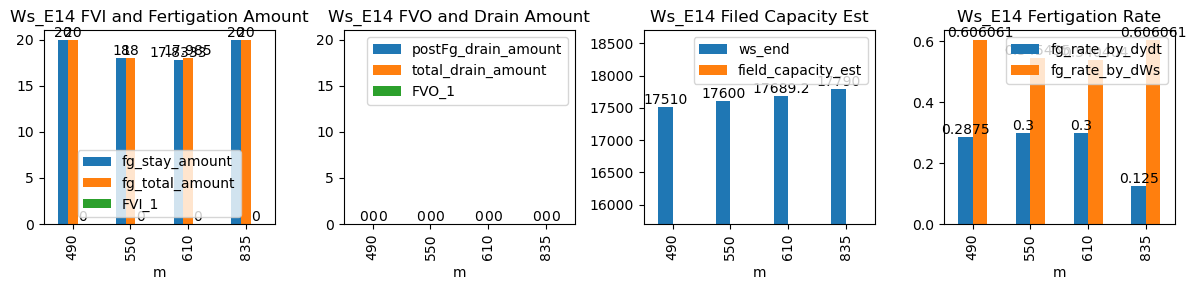
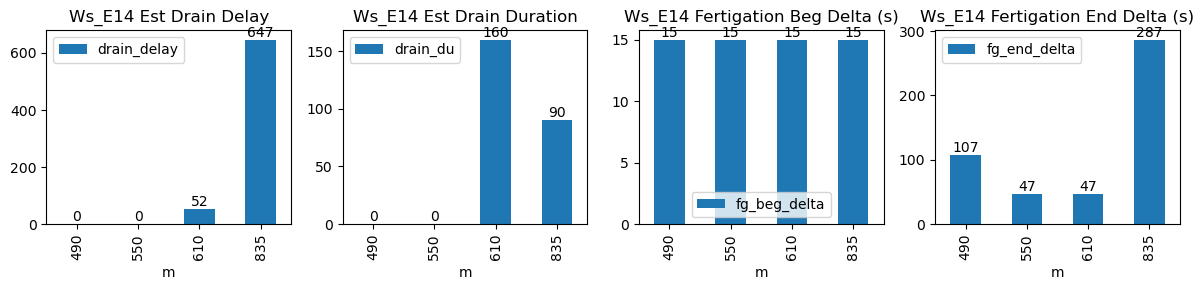
490 |
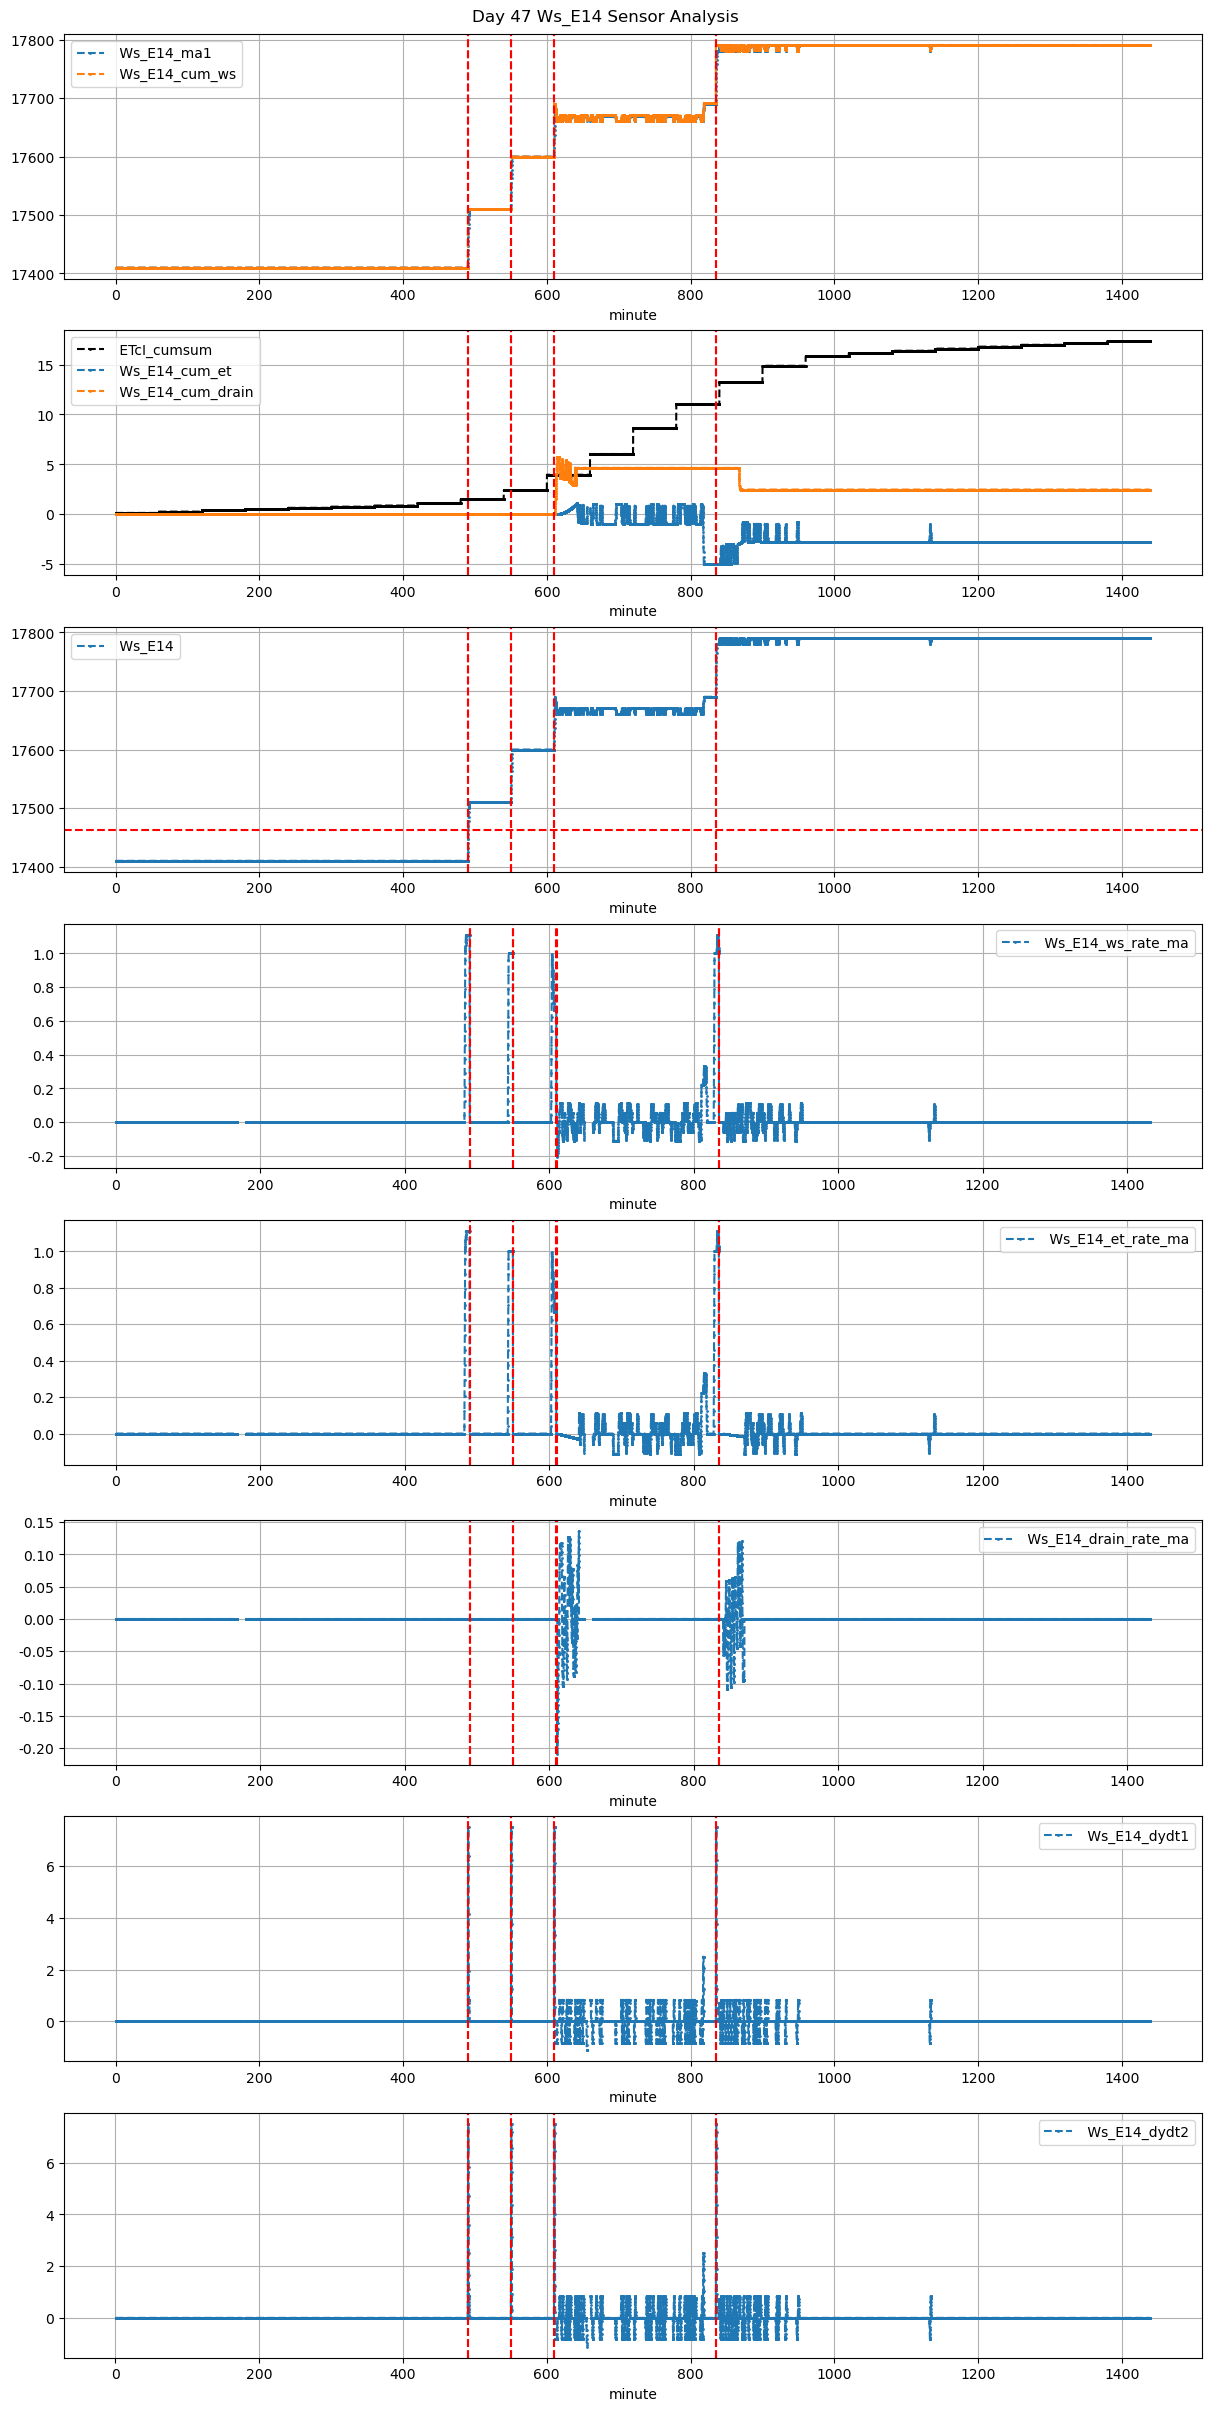
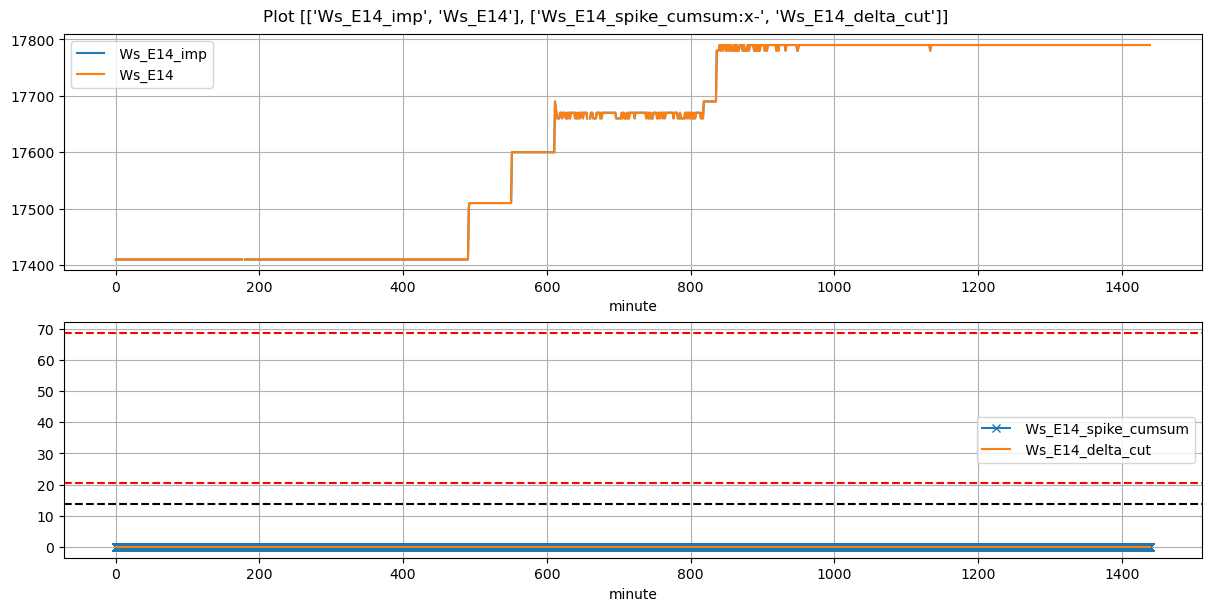
Ws_E14 |
1.41387 |
30 |
490.0 |
490.25 |
490.55 |
492.333333 |
17410.0 |
17510.000000 |
33 |
0.0 |
0.00000 |
0.000000 |
0.2875 |
0.606061 |
20.000000 |
True |
15.0 |
107.0 |
20.000 |
0.0 |
0.0 |
0.0 |
NaN |
NaN |
NaN |
NaN |
NaN |
NaN |
| 2025-11-22 09:10:00+08:00 |
47 |
550 |
Ws_E14 |
1.41387 |
30 |
550.0 |
550.25 |
550.55 |
551.333333 |
17510.0 |
17600.000000 |
33 |
0.0 |
0.00000 |
0.000000 |
0.3000 |
0.545455 |
18.000000 |
True |
15.0 |
47.0 |
18.000 |
0.0 |
0.0 |
0.0 |
NaN |
NaN |
NaN |
NaN |
NaN |
NaN |
| 2025-11-22 10:10:00+08:00 |
47 |
610 |
Ws_E14 |
1.41387 |
30 |
610.0 |
610.25 |
610.55 |
611.333333 |
17600.0 |
17689.166667 |
33 |
0.0 |
0.00000 |
-0.029630 |
0.3000 |
0.540404 |
17.833333 |
True |
15.0 |
47.0 |
17.985 |
0.0 |
0.0 |
0.0 |
160.0 |
52.0 |
-0.132115 |
NaN |
NaN |
NaN |
| 2025-11-22 13:55:00+08:00 |
47 |
835 |
Ws_E14 |
1.41387 |
30 |
835.0 |
835.25 |
835.55 |
840.333333 |
17690.0 |
17790.000000 |
33 |
0.0 |
-0.02963 |
-0.016667 |
0.1250 |
0.606061 |
20.000000 |
True |
15.0 |
287.0 |
20.000 |
0.0 |
0.0 |
0.0 |
90.0 |
647.0 |
-0.104955 |
NaN |
NaN |
NaN |