| 2025-11-21 07:40:00+08:00 |
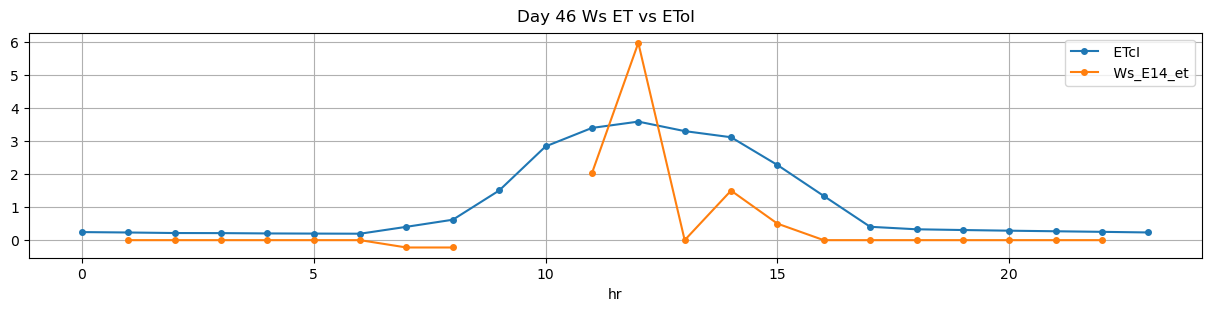
46 |
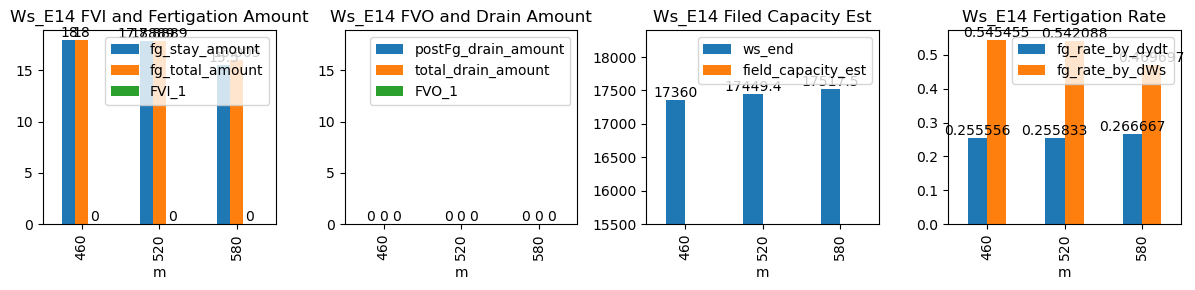
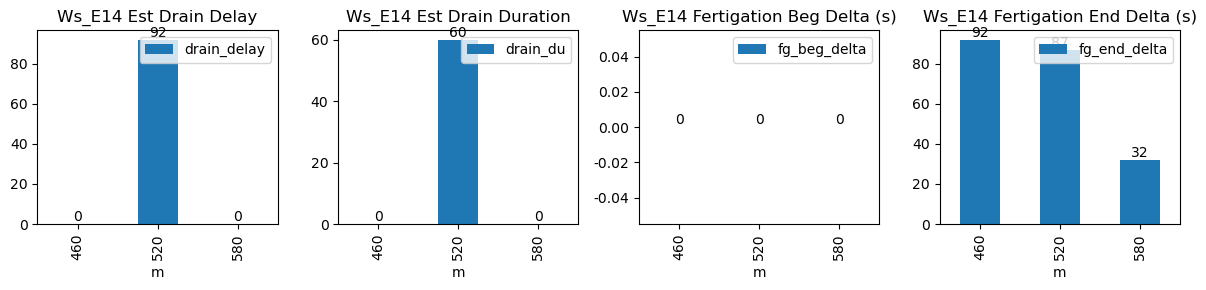
460 |
Ws_E14 |
1.664913 |
30 |
460.0 |
460.0 |
460.55 |
462.083333 |
17270.0 |
17360.000000 |
33 |
0.0 |
0.000000 |
0.0 |
0.255556 |
0.545455 |
18.000000 |
True |
0.0 |
92.0 |
18.000000 |
0.0 |
0.0 |
0.0 |
NaN |
NaN |
NaN |
NaN |
NaN |
NaN |
| 2025-11-21 08:40:00+08:00 |
46 |
520 |
Ws_E14 |
1.664913 |
30 |
520.0 |
520.0 |
520.55 |
522.000000 |
17360.0 |
17449.444444 |
33 |
0.0 |
-0.008591 |
0.0 |
0.255833 |
0.542088 |
17.888889 |
True |
0.0 |
87.0 |
17.888889 |
0.0 |
0.0 |
0.0 |
60.0 |
92.0 |
-0.101389 |
NaN |
NaN |
NaN |
| 2025-11-21 09:40:00+08:00 |
46 |
580 |
Ws_E14 |
1.664913 |
30 |
580.0 |
580.0 |
580.55 |
581.083333 |
17440.0 |
17517.500000 |
33 |
0.0 |
-0.096296 |
0.0 |
0.266667 |
0.469697 |
15.500000 |
True |
0.0 |
32.0 |
16.005000 |
0.0 |
0.0 |
0.0 |
NaN |
NaN |
NaN |
NaN |
NaN |
NaN |