| 2025-12-07 07:45:00+08:00 |
62 |
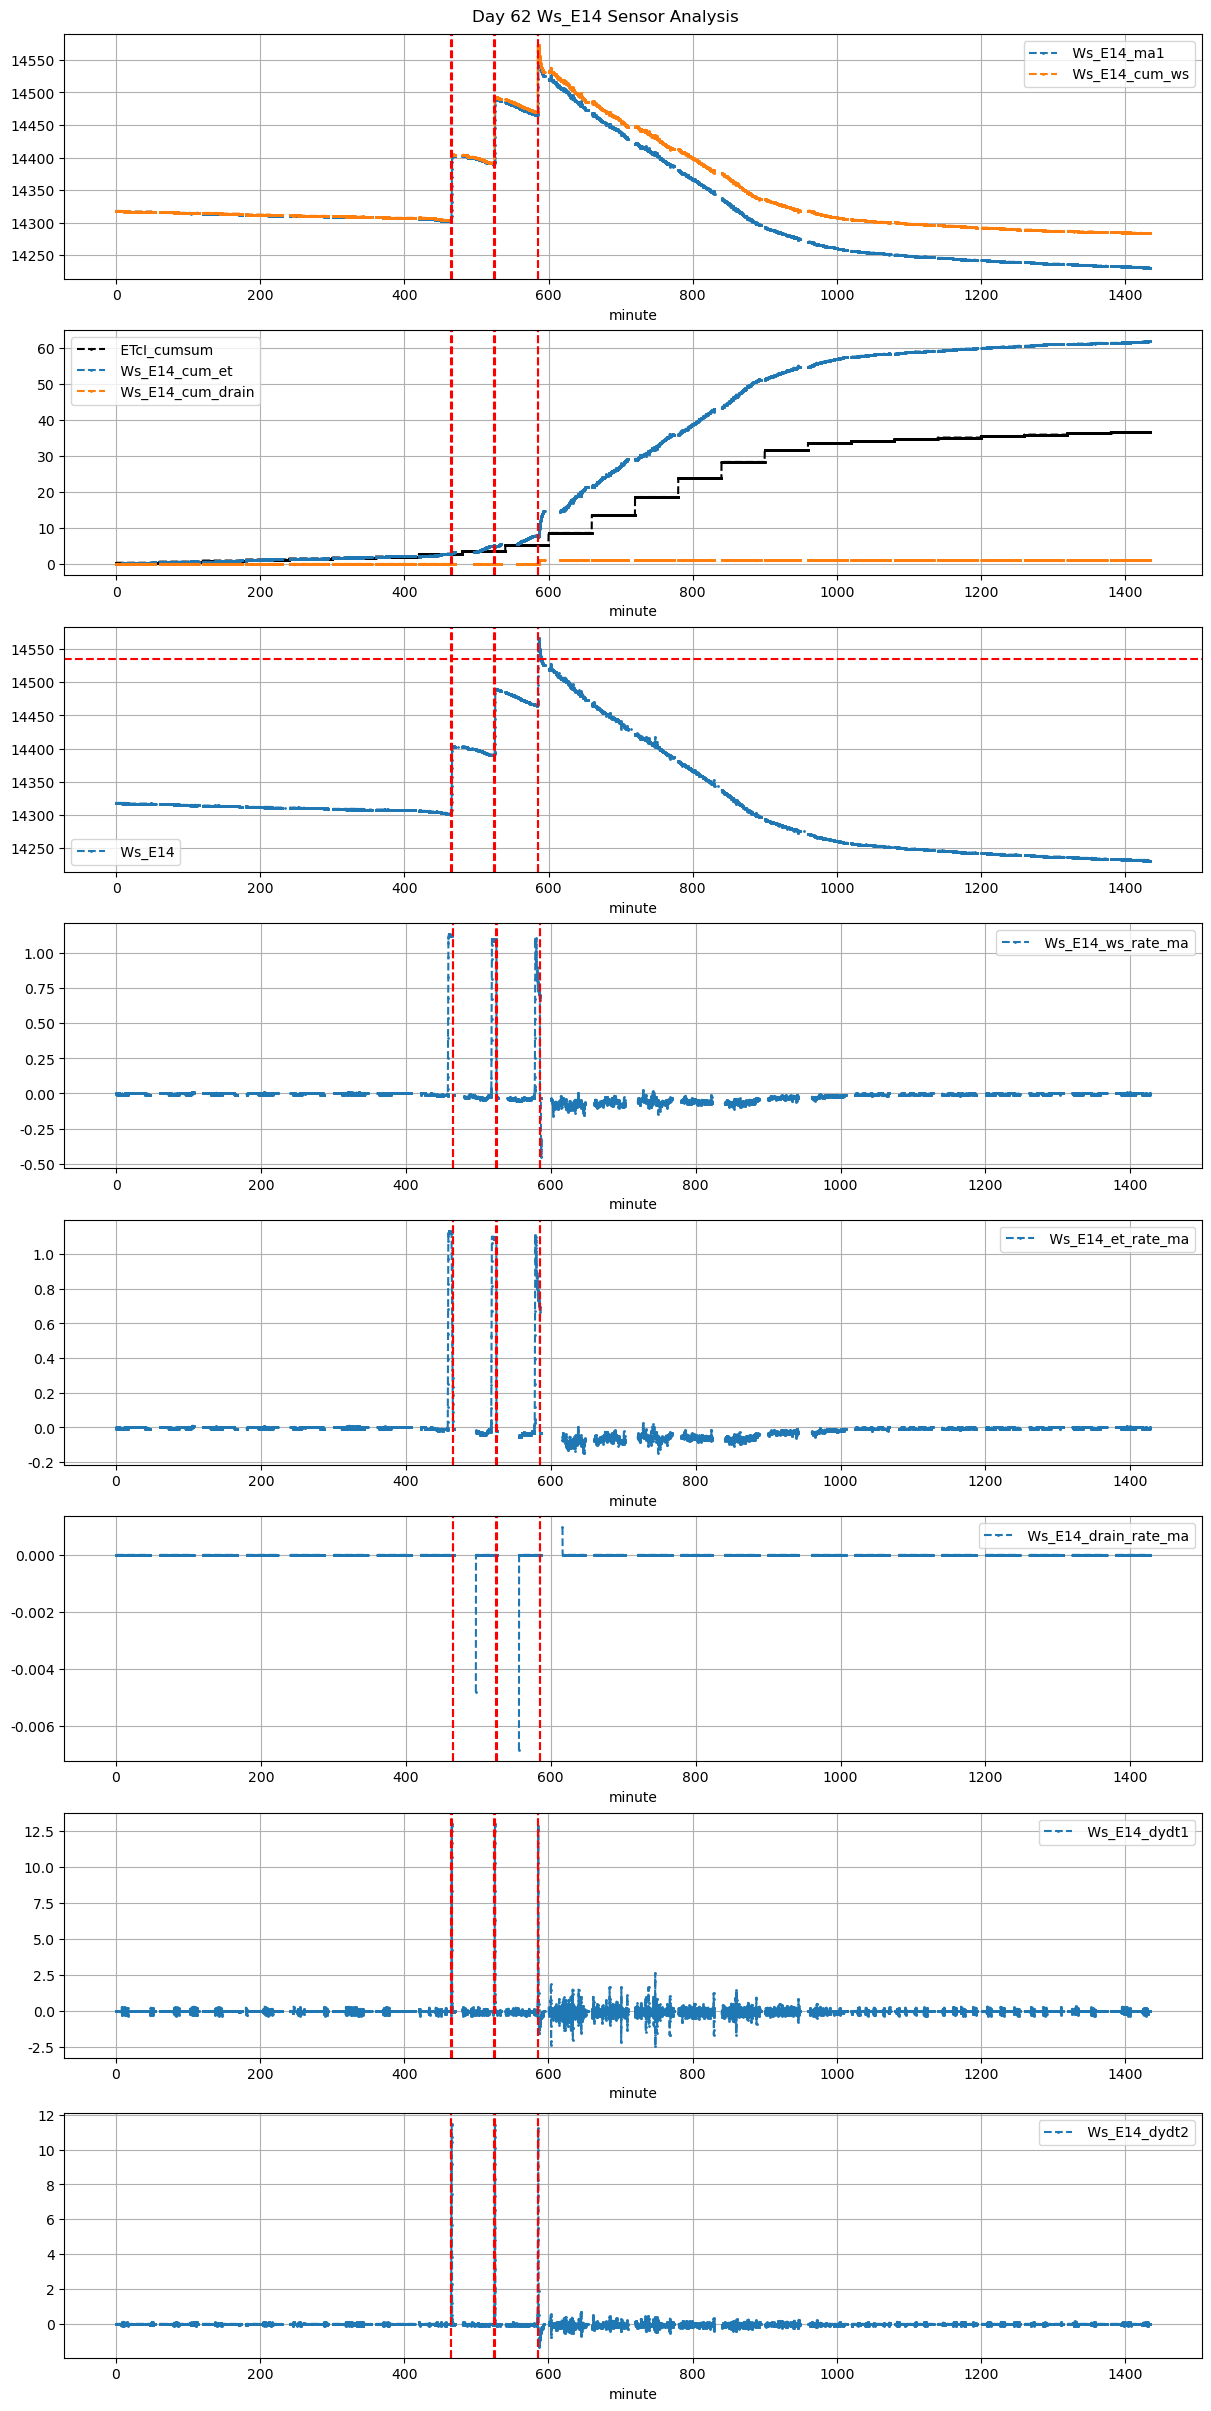
465 |
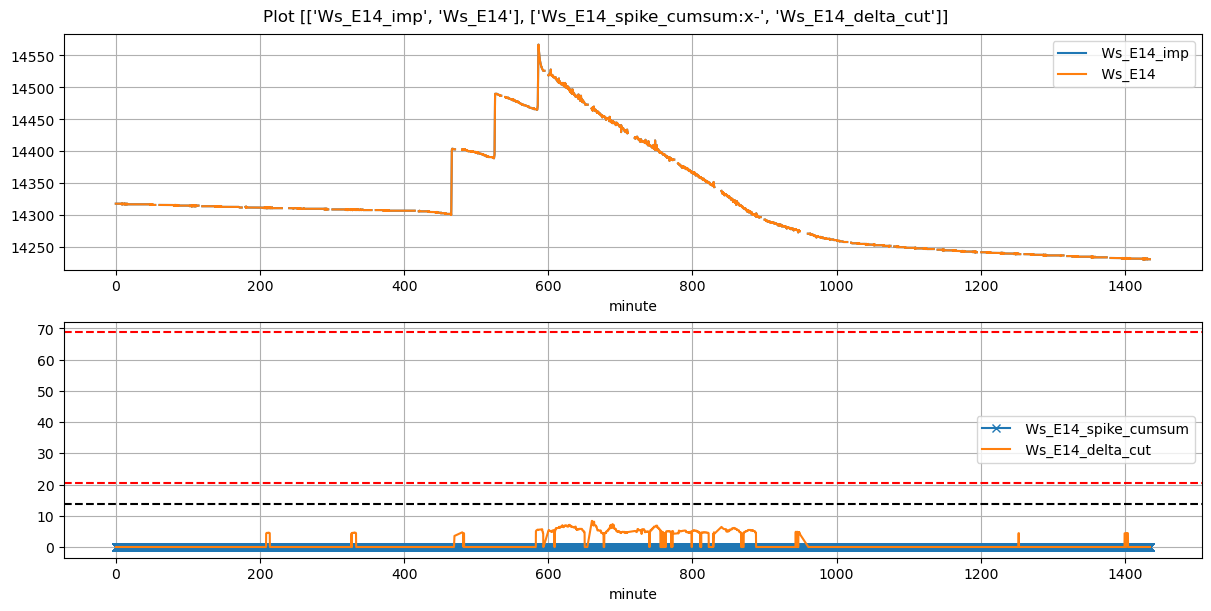
Ws_E14 |
0.371696 |
30 |
465.0 |
465.333333 |
465.62 |
466.750000 |
14302.0 |
14404.0 |
37 |
-0.011054 |
NaN |
-0.017407 |
0.397429 |
0.551351 |
20.4 |
True |
20.0 |
67.8 |
20.4 |
0.0 |
0 |
0.0 |
NaN |
NaN |
NaN |
NaN |
NaN |
NaN |
| 2025-12-07 08:45:00+08:00 |
62 |
525 |
Ws_E14 |
0.371696 |
30 |
525.0 |
525.333333 |
525.62 |
526.250000 |
14390.0 |
14490.0 |
37 |
-0.022867 |
-0.033333 |
-0.043148 |
0.423429 |
0.540541 |
20.0 |
True |
20.0 |
37.8 |
20.0 |
0.0 |
0 |
0.0 |
NaN |
NaN |
NaN |
NaN |
NaN |
NaN |
| 2025-12-07 09:45:00+08:00 |
62 |
585 |
Ws_E14 |
0.371696 |
30 |
585.0 |
585.333333 |
585.62 |
586.333333 |
14466.0 |
14566.5 |
37 |
-0.030491 |
-0.393939 |
-0.071800 |
0.413381 |
0.543243 |
20.1 |
True |
20.0 |
42.8 |
20.1 |
0.0 |
0 |
0.0 |
NaN |
NaN |
NaN |
NaN |
NaN |
NaN |