| 2025-12-06 09:15:00+08:00 |
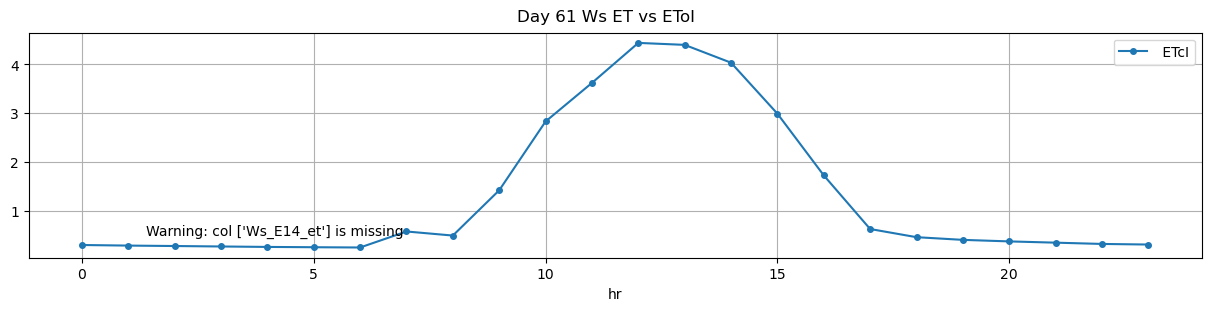
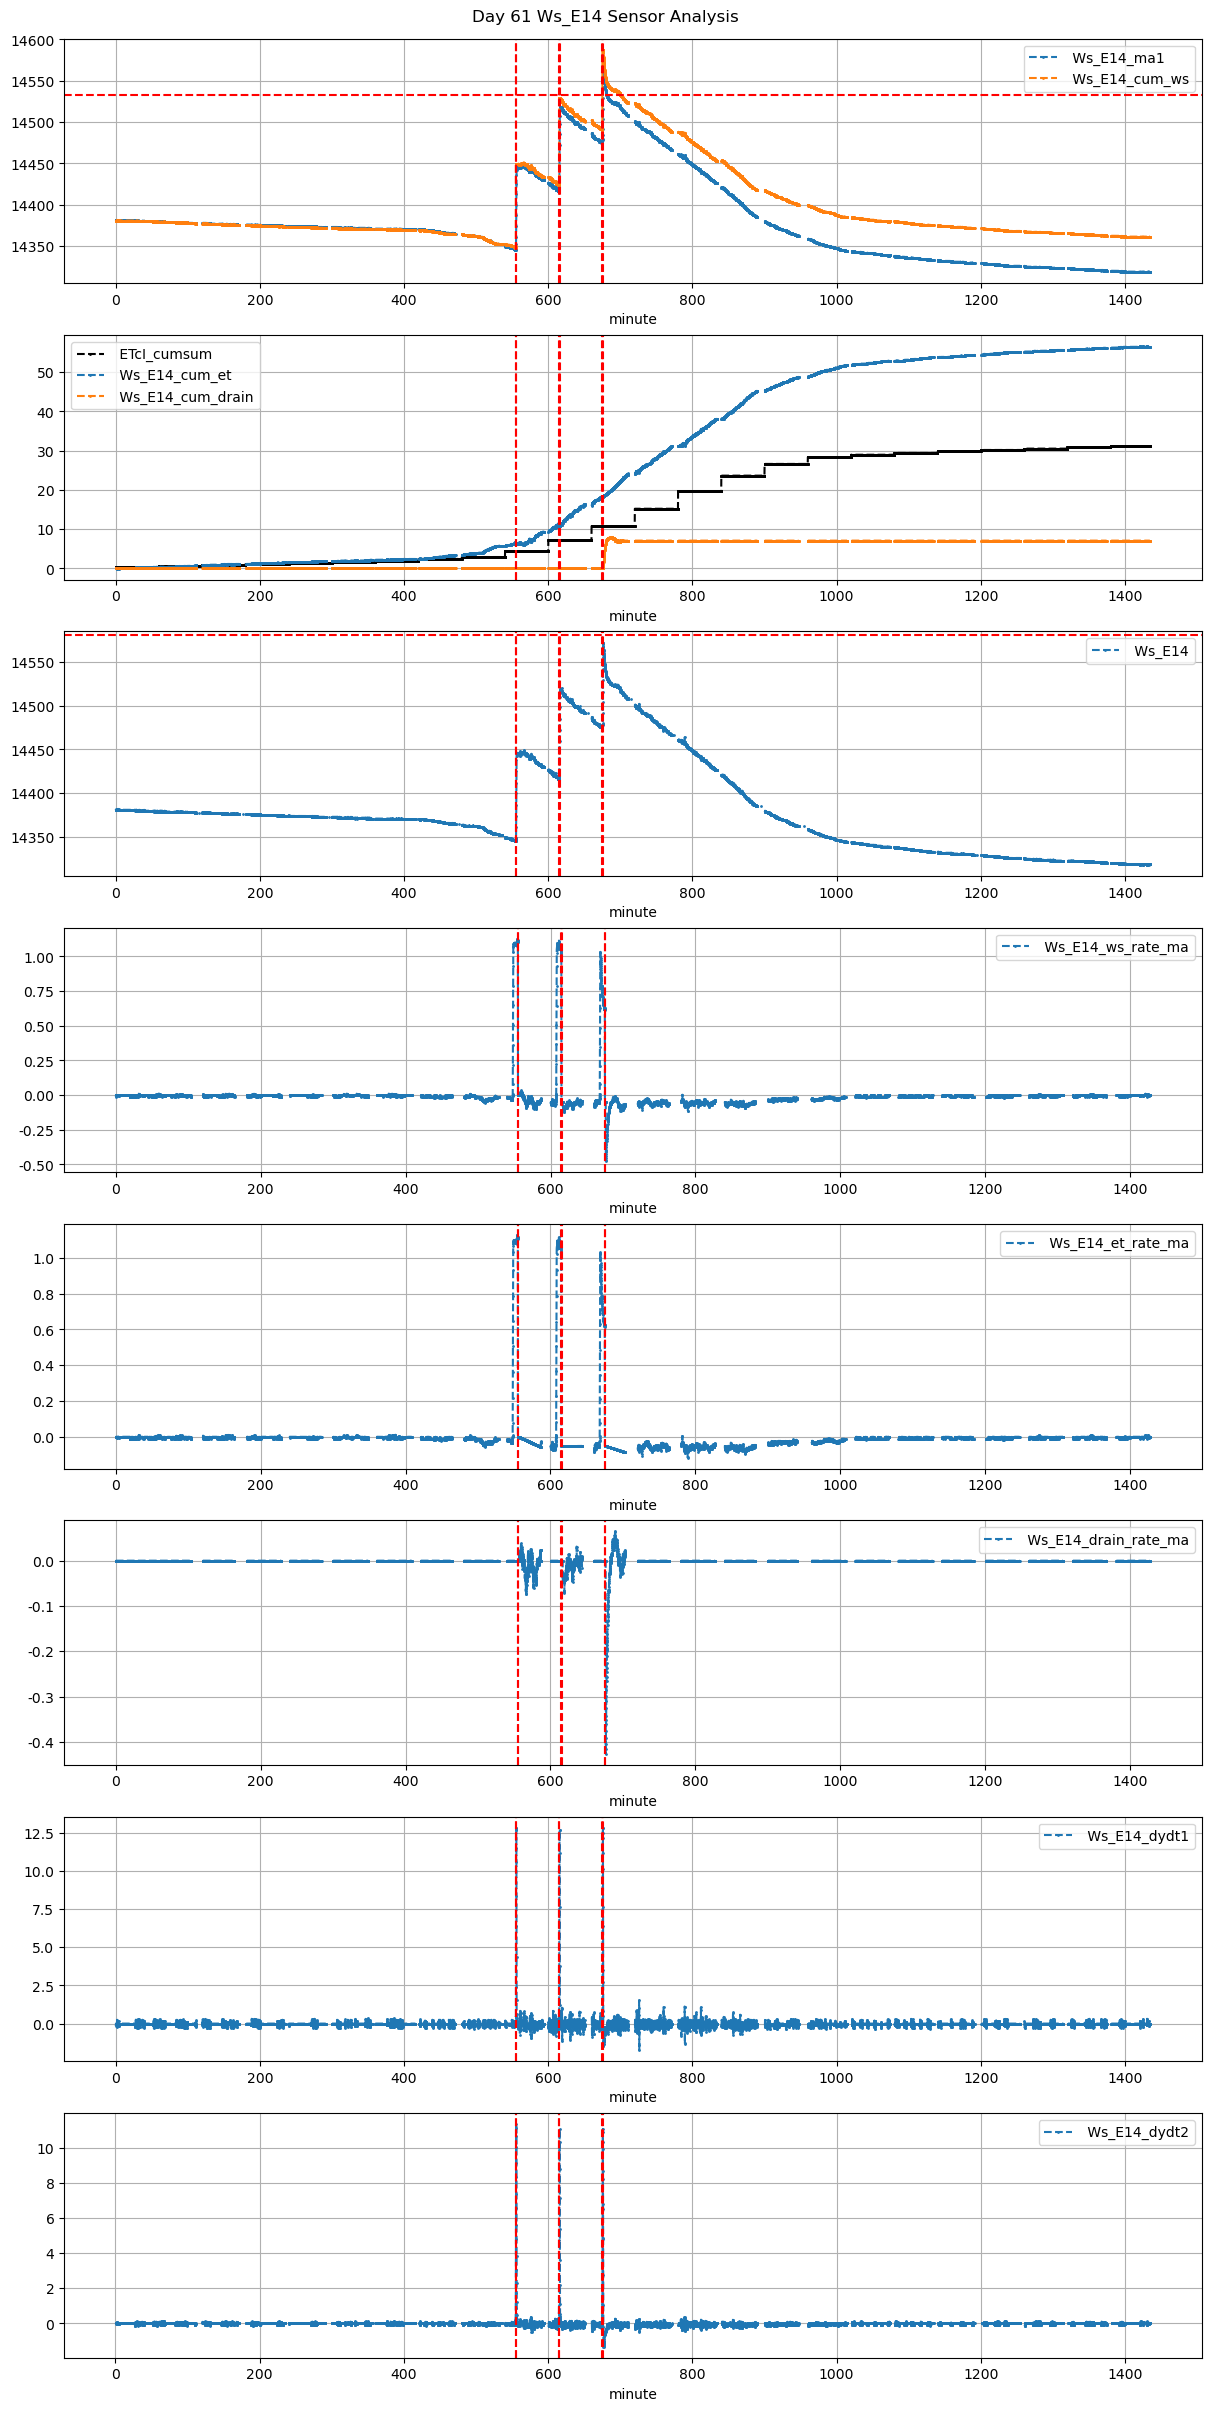
61 |
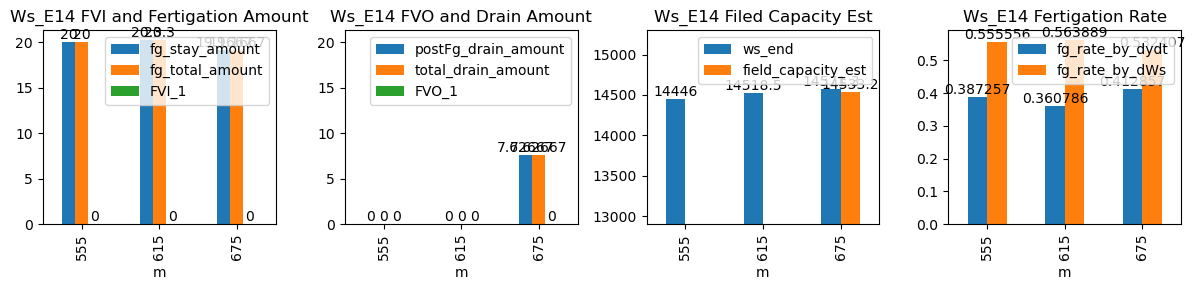
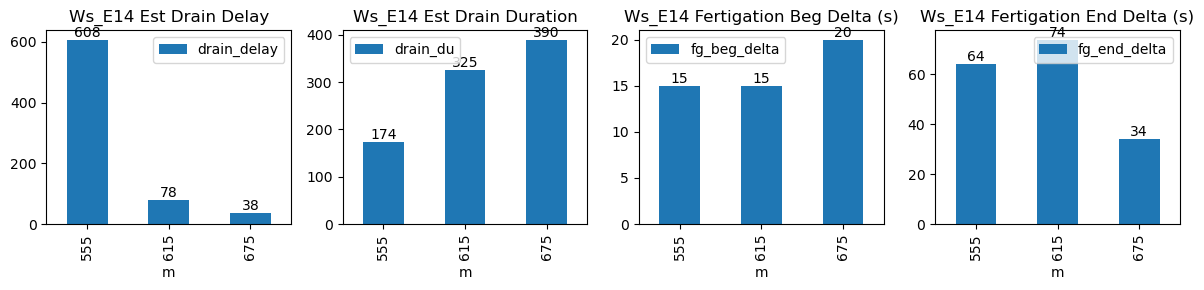
555 |
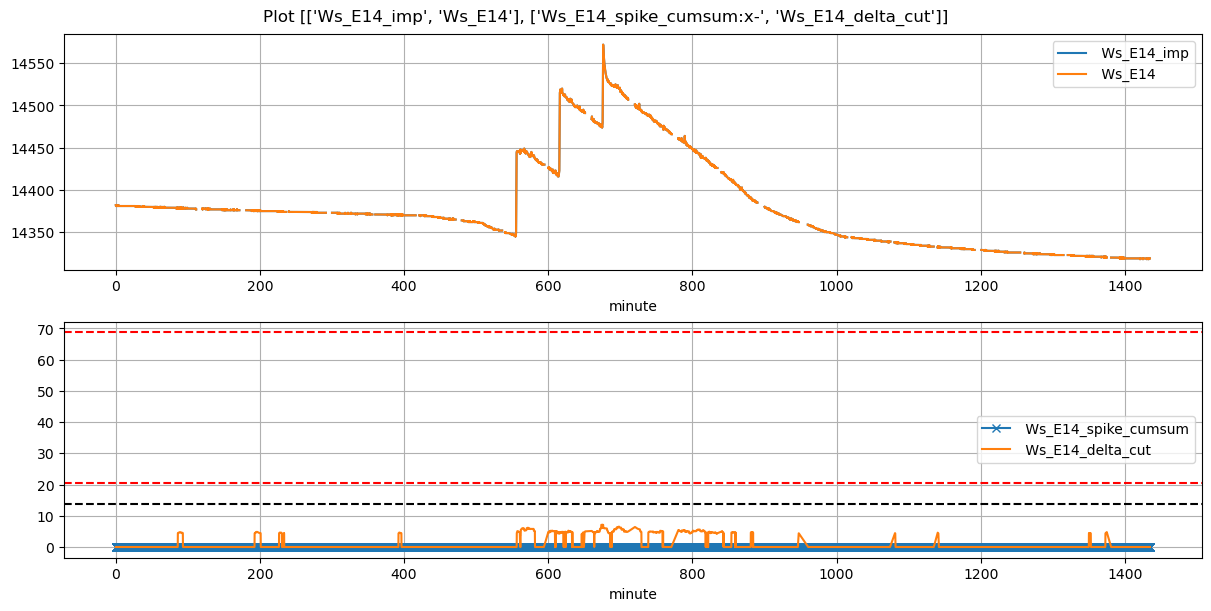
Ws_E14 |
0.342435 |
30 |
555.0 |
555.250000 |
555.6 |
556.666667 |
14346.0 |
14446.000000 |
36 |
-0.023089 |
-0.001173 |
-0.056883 |
0.387257 |
0.555556 |
20.000000 |
True |
15.0 |
64.0 |
20.000000 |
0.0 |
0.000000 |
0.000000 |
174 |
608 |
-0.054330 |
NaN |
NaN |
NaN |
| 2025-12-06 10:15:00+08:00 |
61 |
615 |
Ws_E14 |
0.342435 |
30 |
615.0 |
615.250000 |
615.6 |
616.833333 |
14417.0 |
14518.500000 |
36 |
-0.052788 |
-0.081270 |
-0.051314 |
0.360786 |
0.563889 |
20.300000 |
True |
15.0 |
74.0 |
20.300000 |
0.0 |
0.000000 |
0.000000 |
325 |
78 |
-0.043228 |
NaN |
NaN |
NaN |
| 2025-12-06 11:15:00+08:00 |
61 |
675 |
Ws_E14 |
0.342435 |
30 |
675.0 |
675.333333 |
675.6 |
676.166667 |
14475.5 |
14571.333333 |
36 |
-0.051195 |
-0.180802 |
-0.087305 |
0.412857 |
0.532407 |
19.166667 |
True |
20.0 |
34.0 |
19.166667 |
0.0 |
7.626672 |
7.626672 |
390 |
38 |
-0.330619 |
14533.199975 |
NaN |
NaN |