| 2025-12-05 08:21:07+08:00 |
60 |
501 |
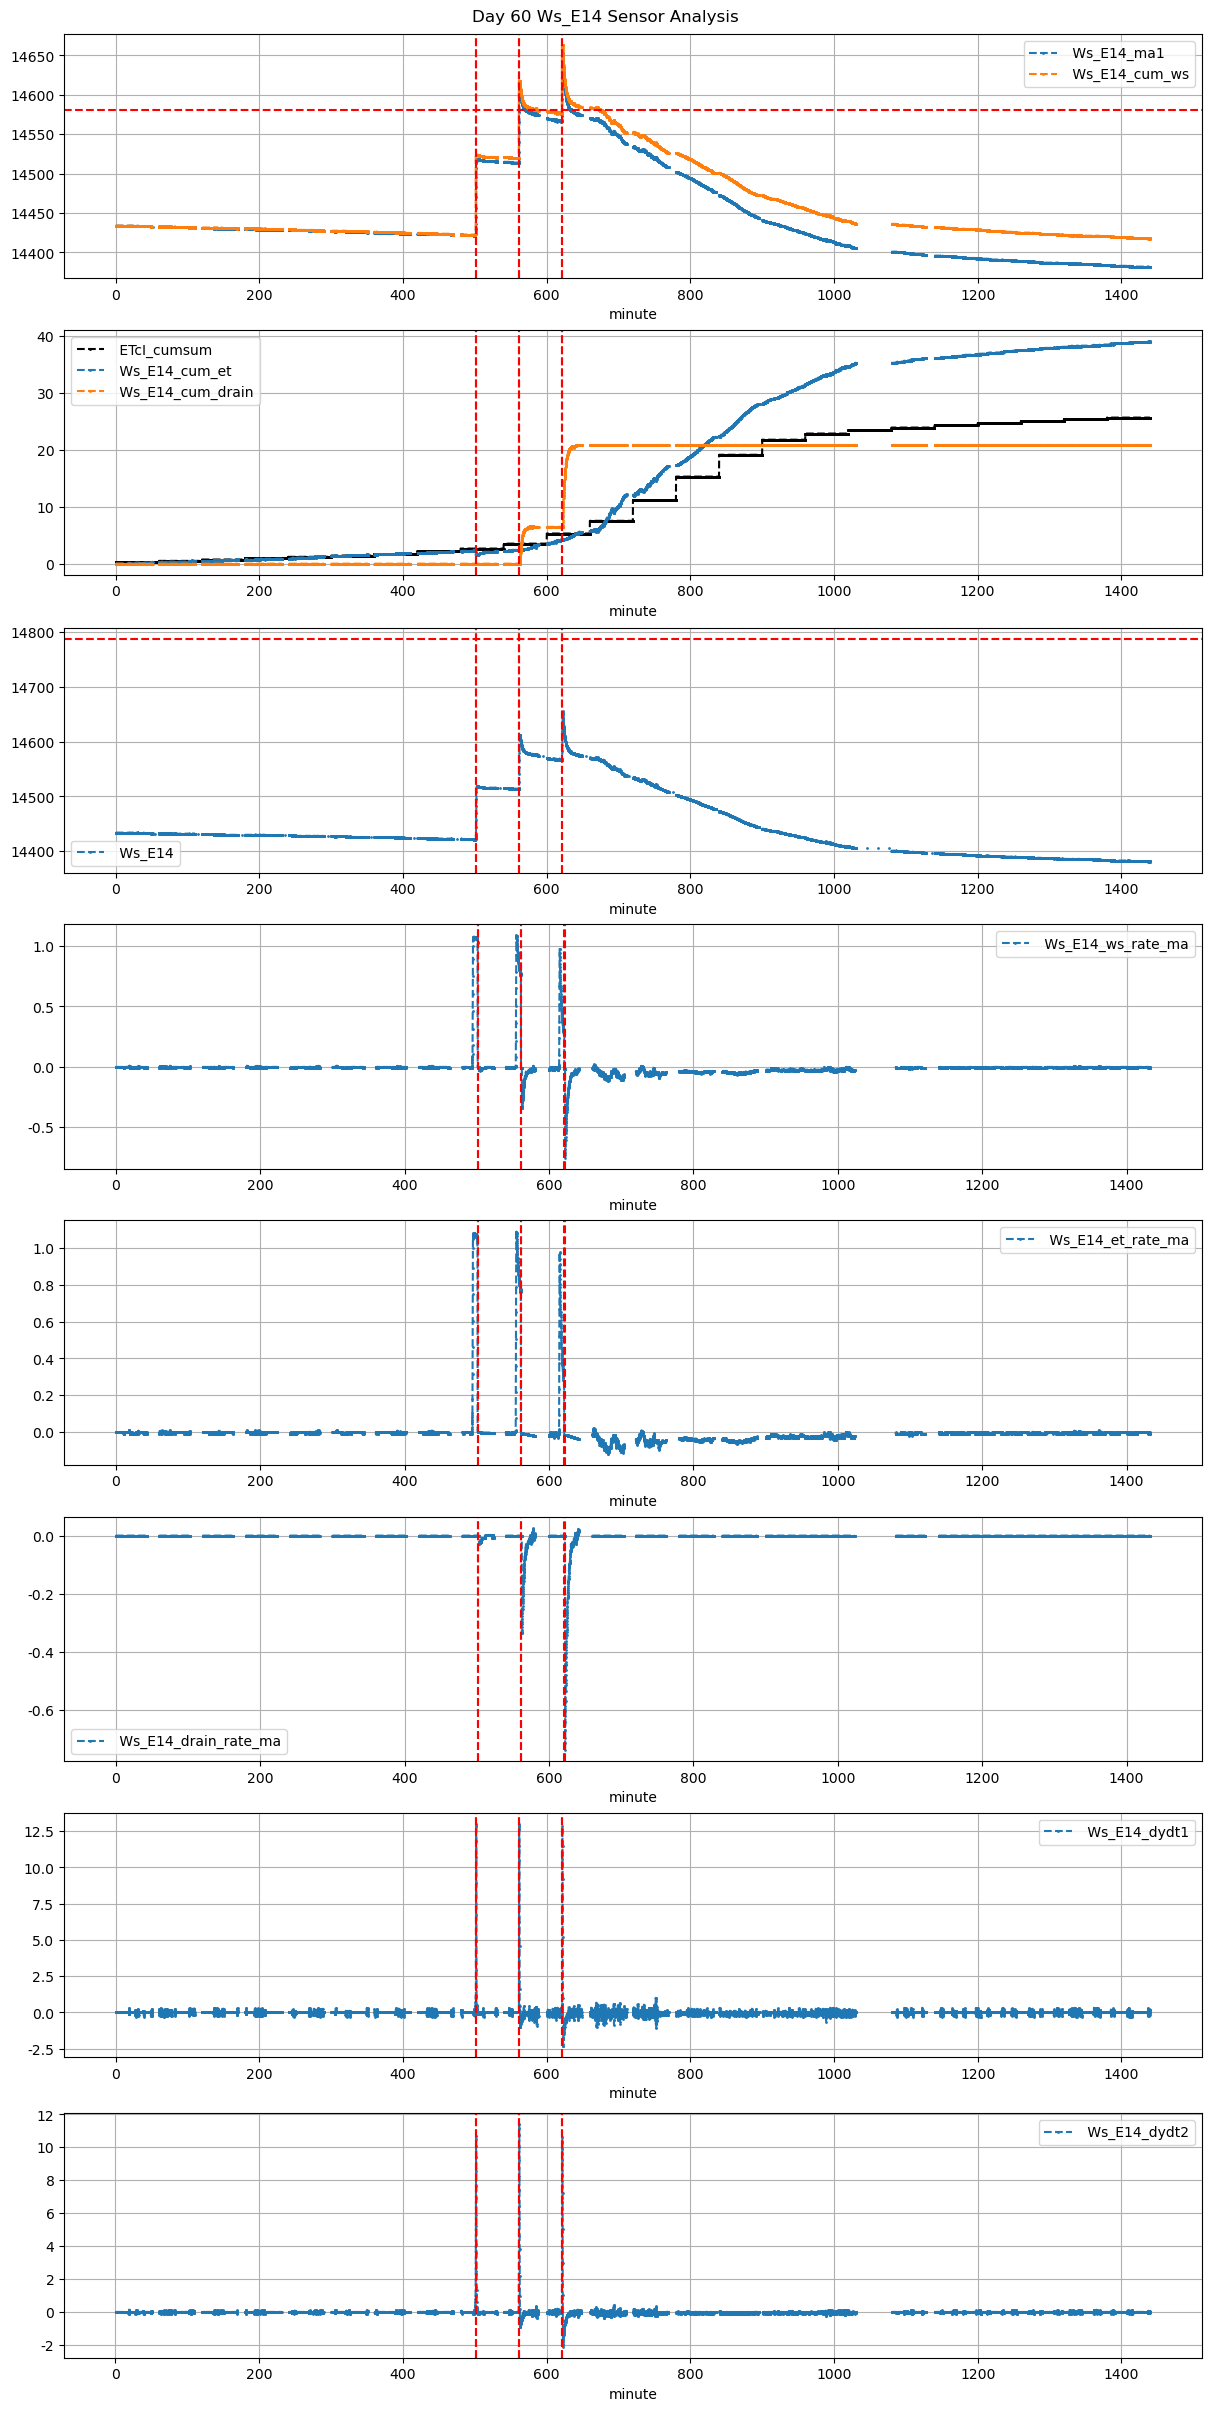
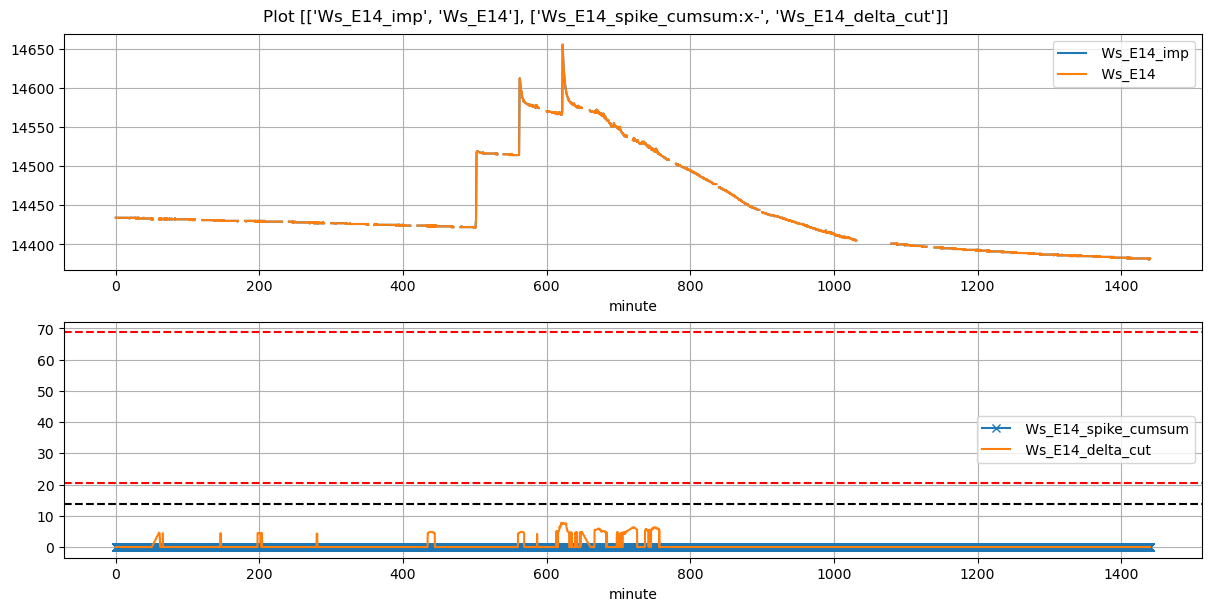
Ws_E14 |
0.436537 |
30 |
501.12 |
501.416667 |
501.72 |
503.000000 |
14421.386667 |
14519.000000 |
36 |
-0.001433 |
-0.016667 |
-0.002284 |
0.349841 |
0.542296 |
19.522667 |
True |
17.8 |
76.8 |
19.522667 |
0.0 |
0.000000 |
0.000000 |
459 |
116 |
-0.024517 |
NaN |
NaN |
NaN |
| 2025-12-05 09:21:07+08:00 |
60 |
561 |
Ws_E14 |
0.436537 |
30 |
561.12 |
561.416667 |
561.72 |
562.416667 |
14514.000000 |
14611.750000 |
36 |
-0.006008 |
-0.135494 |
-0.020220 |
0.419000 |
0.543056 |
19.550000 |
True |
17.8 |
41.8 |
19.550000 |
0.0 |
6.445657 |
6.445657 |
714 |
46 |
-0.266578 |
14579.521715 |
NaN |
NaN |
| 2025-12-05 10:21:07+08:00 |
60 |
621 |
Ws_E14 |
0.436537 |
30 |
621.12 |
621.500000 |
621.72 |
622.250000 |
14566.500000 |
14653.333333 |
36 |
-0.013333 |
-0.289815 |
-0.036235 |
0.398857 |
0.482407 |
17.366667 |
True |
22.8 |
31.8 |
17.892000 |
0.5 |
14.106160 |
14.606160 |
834 |
36 |
-0.520041 |
14582.802534 |
NaN |
NaN |