| 2025-12-04 09:00:00+08:00 |
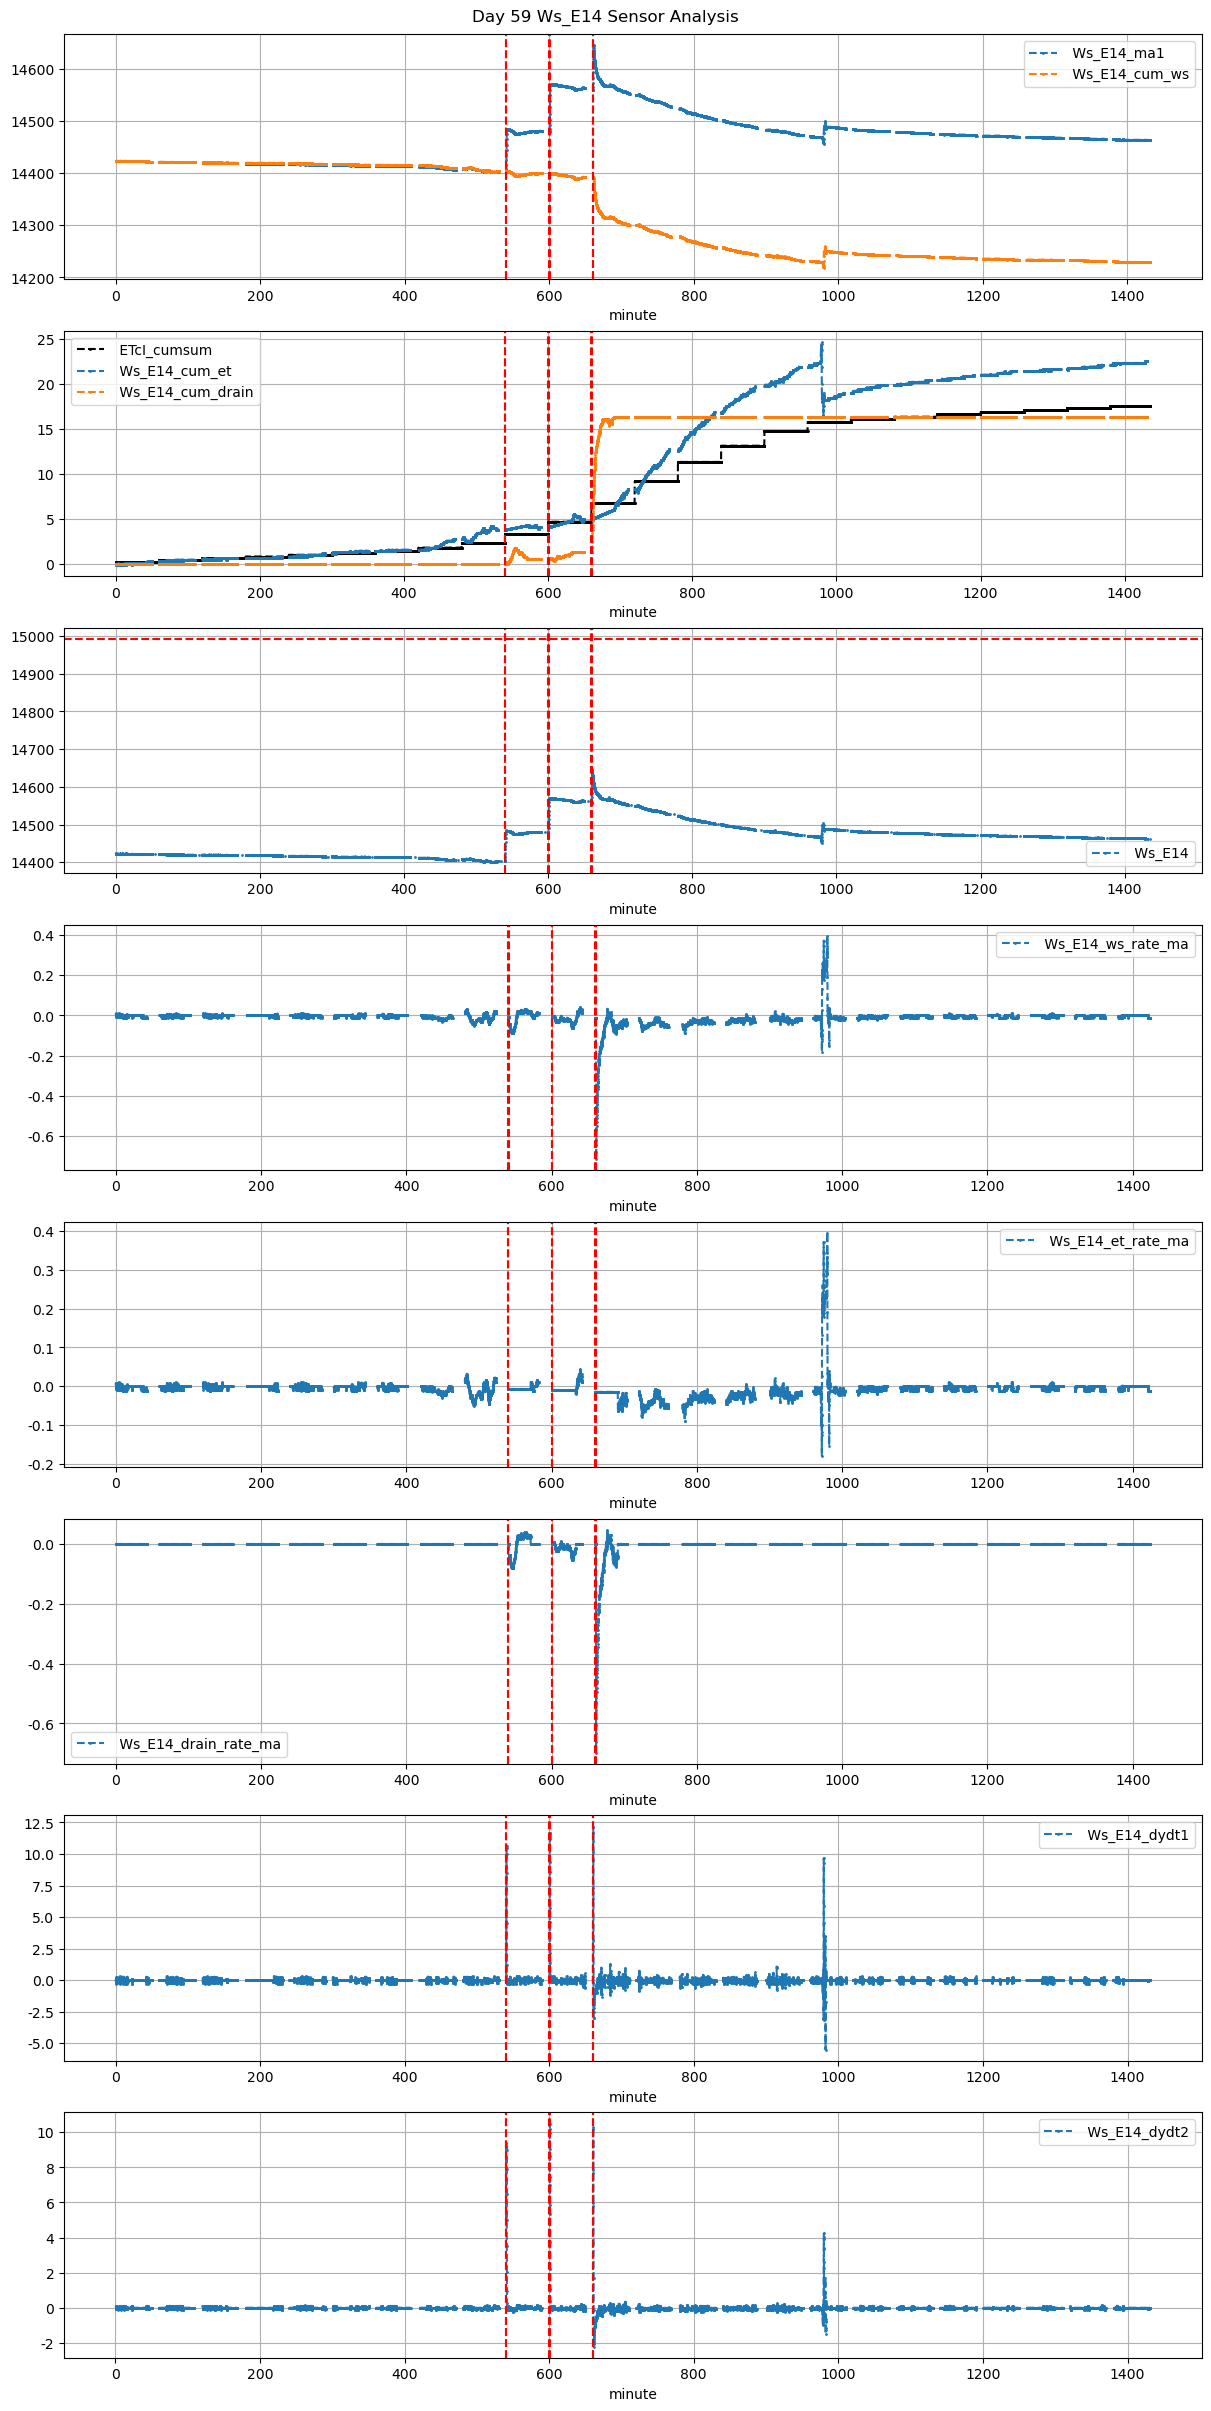
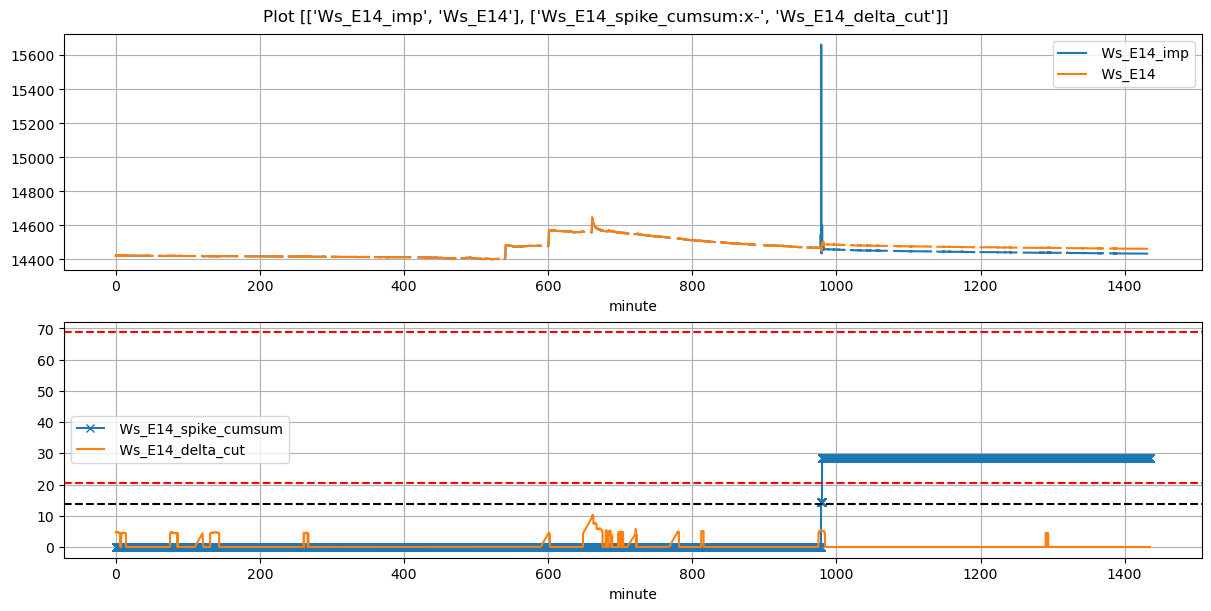
59 |
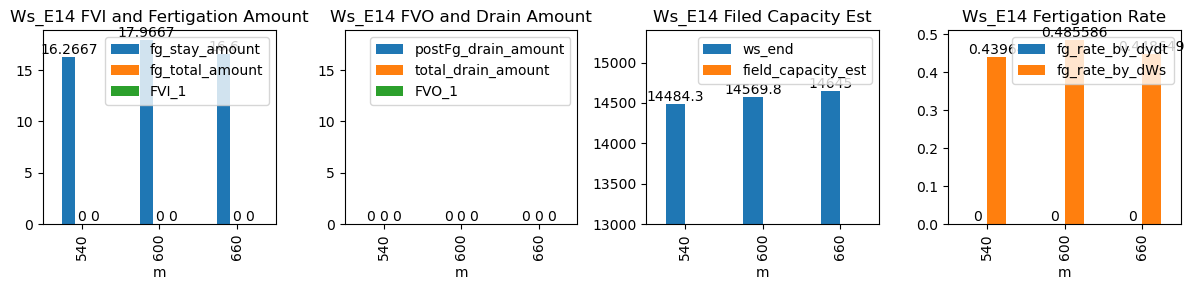
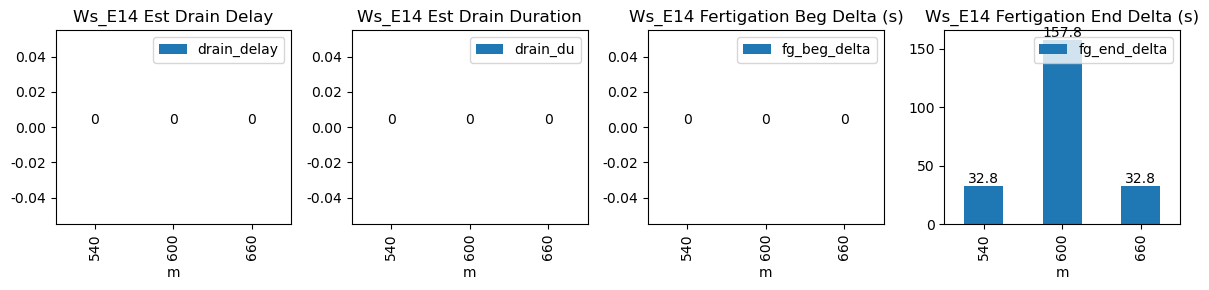
540 |
Ws_E14 |
0.429266 |
30 |
540.0 |
NaN |
540.62 |
541.166667 |
14403.0 |
14484.333333 |
37 |
-0.006901 |
-0.069889 |
-0.006901 |
NaN |
0.439640 |
16.266667 |
False |
NaN |
32.8 |
NaN |
NaN |
NaN |
NaN |
NaN |
NaN |
NaN |
NaN |
NaN |
NaN |
| 2025-12-04 10:00:00+08:00 |
59 |
600 |
Ws_E14 |
0.429266 |
30 |
600.0 |
NaN |
600.62 |
603.250000 |
14480.0 |
14569.833333 |
37 |
-0.009612 |
-0.024568 |
-0.009612 |
NaN |
0.485586 |
17.966667 |
False |
NaN |
157.8 |
NaN |
NaN |
NaN |
NaN |
NaN |
NaN |
NaN |
NaN |
NaN |
NaN |
| 2025-12-04 11:00:00+08:00 |
59 |
660 |
Ws_E14 |
0.429266 |
30 |
660.0 |
NaN |
660.62 |
661.166667 |
14562.0 |
14645.000000 |
37 |
-0.014388 |
-0.292022 |
-0.014388 |
NaN |
0.448649 |
16.600000 |
False |
NaN |
32.8 |
NaN |
NaN |
NaN |
NaN |
NaN |
NaN |
NaN |
NaN |
NaN |
NaN |