VI and VO Daily Summary
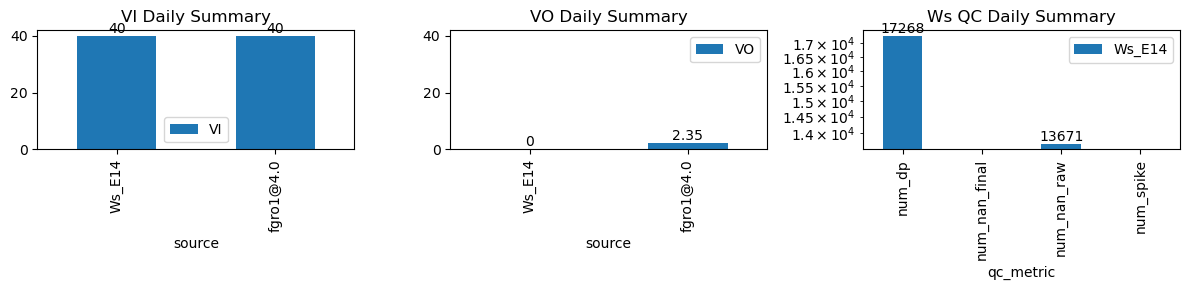
| ws_name | num_dp | num_nan_raw | num_nan_final | num_spike | cum_step_adj |
|---|---|---|---|---|---|
| Ws_E14 | 17,268 | 13,671 | 0 | 0 | 0.00 |
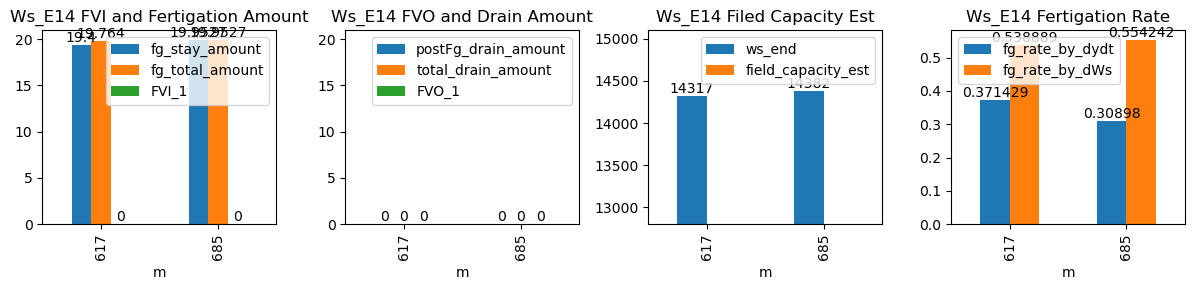
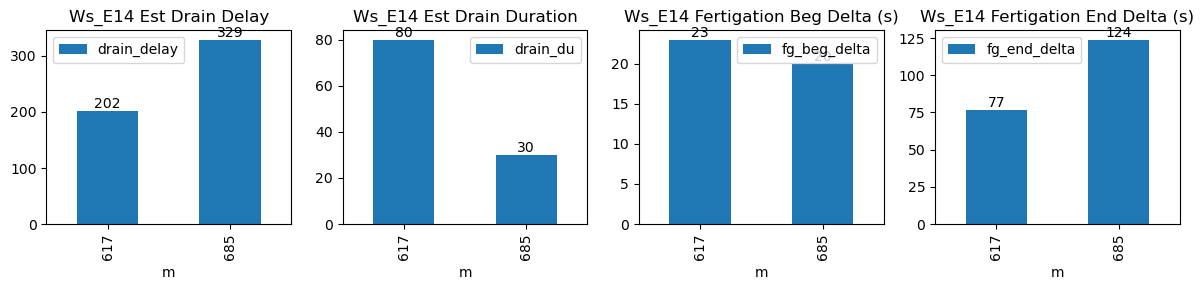
| ds | d | m | ws_name | prominence_cut | max_drain_du | fg_beg | fg_beg_est | fg_end | fg_end_est | ws_beg | ws_end | duc | pre_fg_et | post_fg_ws | post_drn_et | fg_rate_by_dydt | fg_rate_by_dWs | fg_stay_amount | enough_data | fg_beg_delta | fg_end_delta | fg_total_amount | fg_drain_amount | postFg_drain_amount | total_drain_amount | drain_du | drain_delay | drain_rate | field_capacity_est | FVI_1 | FVO_1 |
|---|---|---|---|---|---|---|---|---|---|---|---|---|---|---|---|---|---|---|---|---|---|---|---|---|---|---|---|---|---|---|---|
| 2025-12-17 10:17:12+08:00 | 72 | 617 | Ws_E14 | 0.263331 | 30 | 617.2 | 617.583333 | 617.8 | 619.083333 | 14220.000000 | 14317.0 | 36 | -0.031890 | -0.037284 | -0.049163 | 0.371429 | 0.538889 | 19.400000 | True | 23.0 | 77.0 | 19.764000 | 0.0 | 0 | 0.0 | 80 | 202 | -0.023291 | NaN | NaN | NaN |
| 2025-12-17 11:25:00+08:00 | 72 | 685 | Ws_E14 | 0.263331 | 30 | 685.0 | 685.333333 | 685.6 | 687.666667 | 14282.236364 | 14382.0 | 36 | -0.051536 | -0.053272 | -0.049114 | 0.308980 | 0.554242 | 19.952727 | True | 20.0 | 124.0 | 19.952727 | 0.0 | 0 | 0.0 | 30 | 329 | -0.029689 | NaN | NaN | NaN |