| 2025-12-16 09:52:14+08:00 |
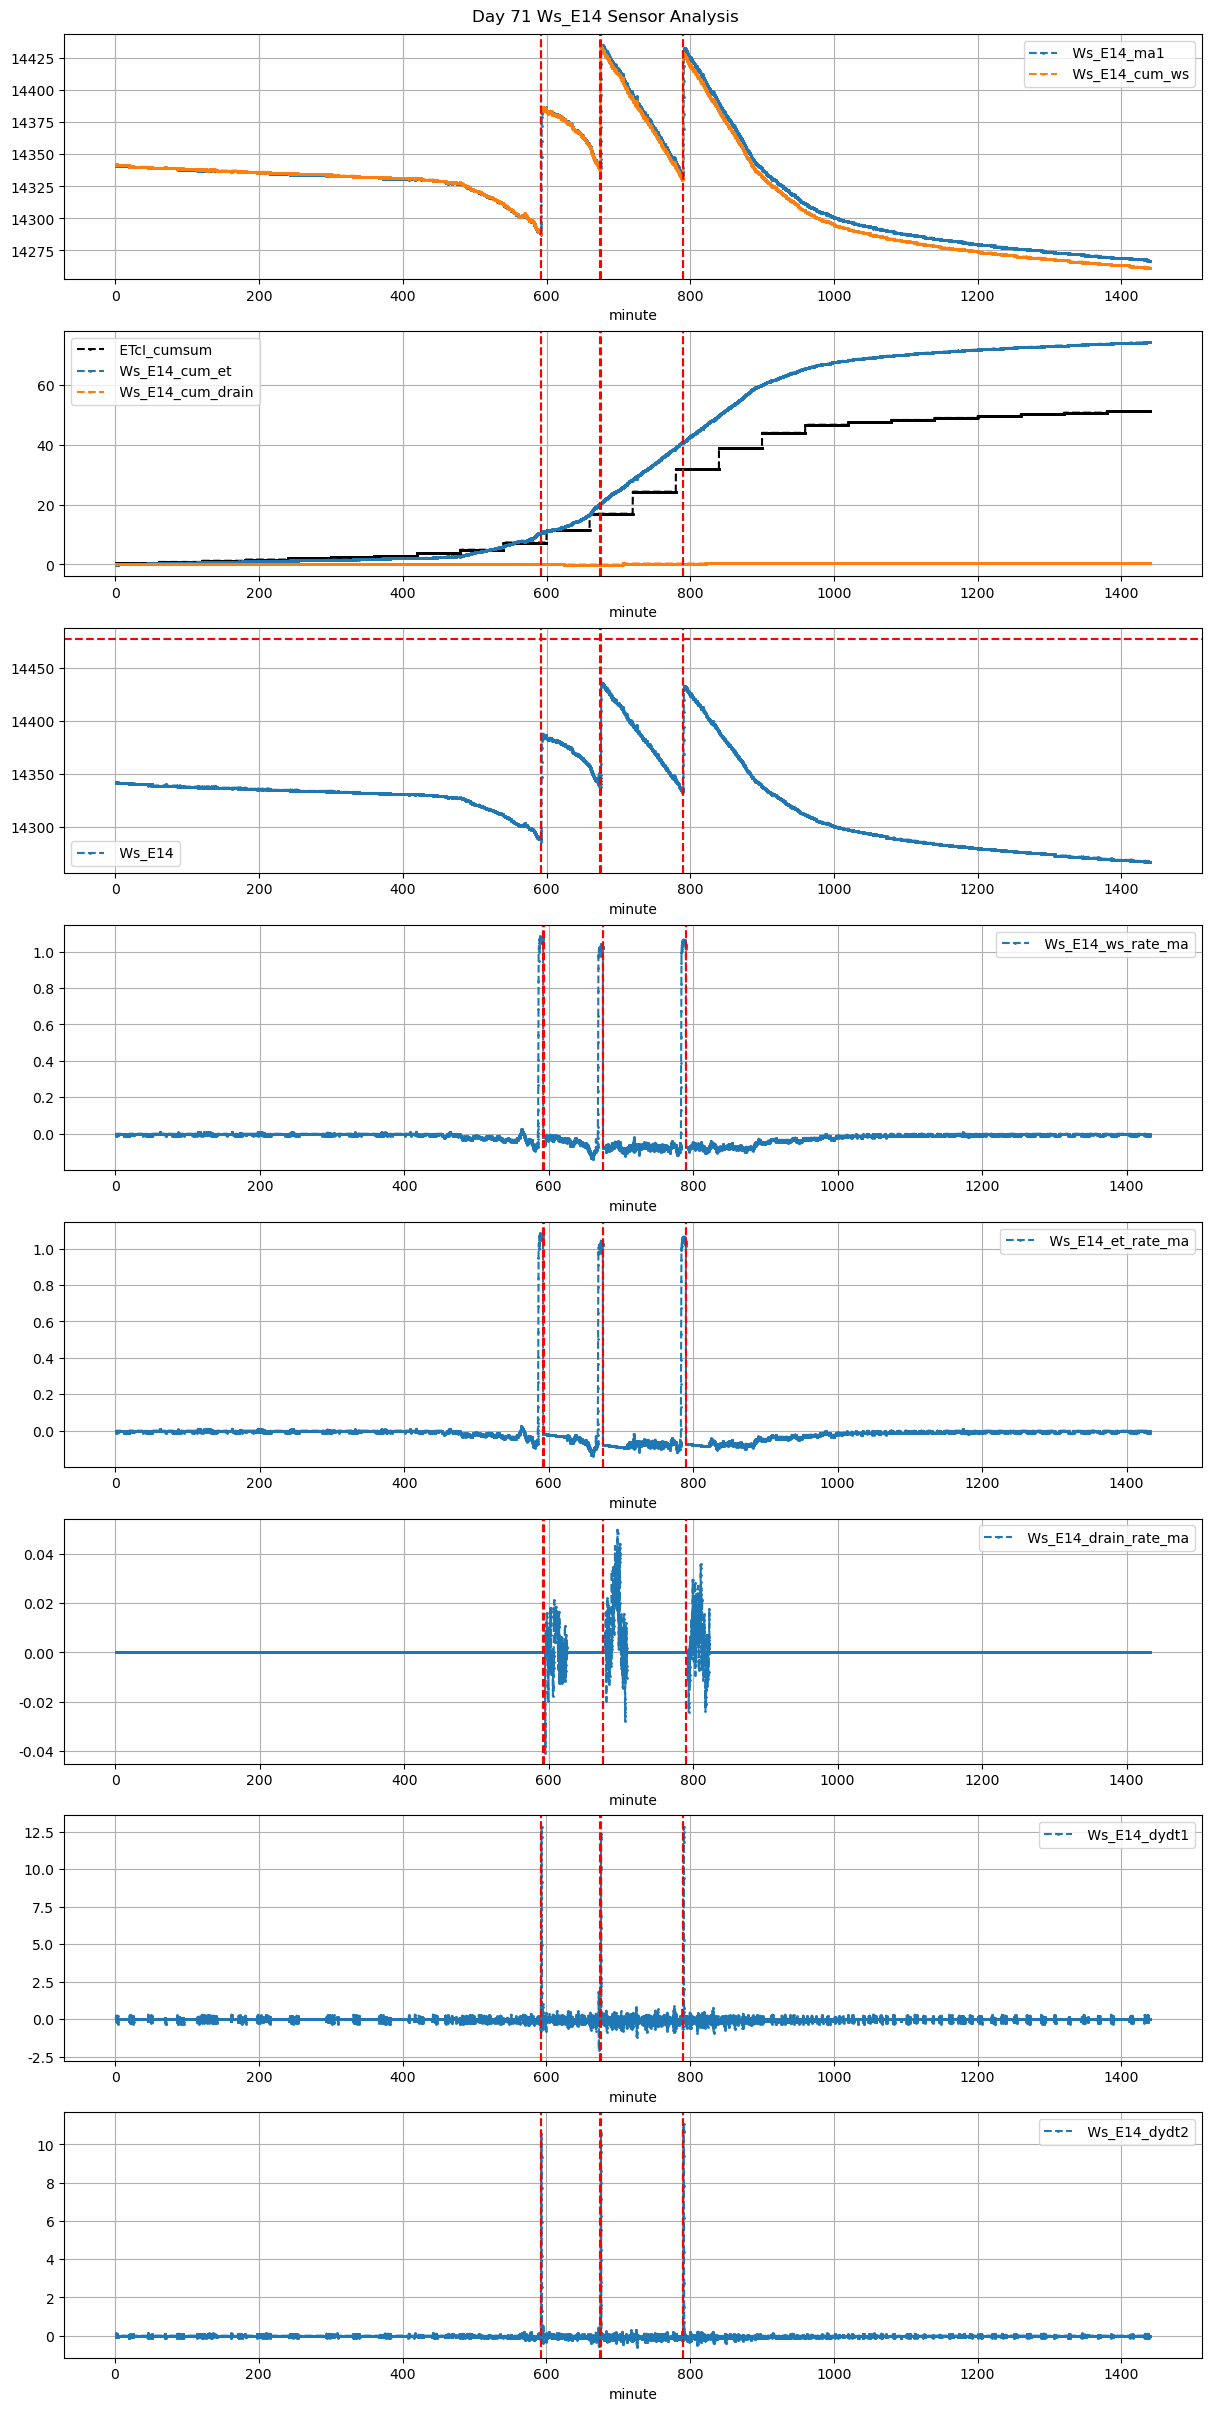
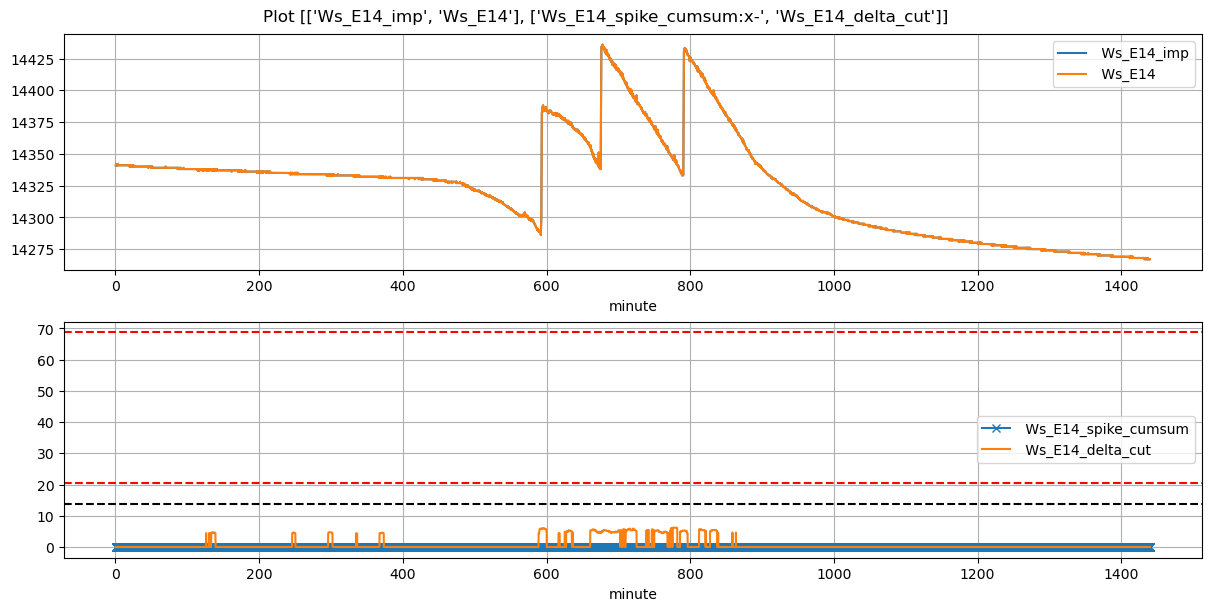
71 |
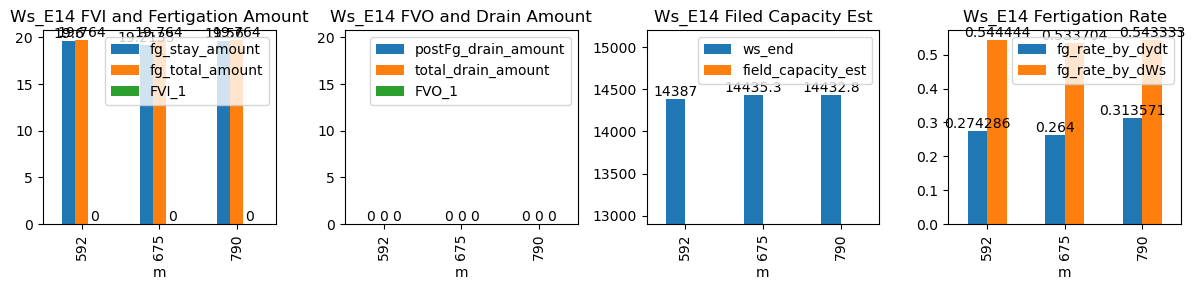
592 |
Ws_E14 |
0.265887 |
30 |
592.23 |
592.500000 |
592.83 |
595.000000 |
14289.0 |
14387.000000 |
36 |
-0.072169 |
-0.019743 |
-0.034136 |
0.274286 |
0.544444 |
19.600000 |
True |
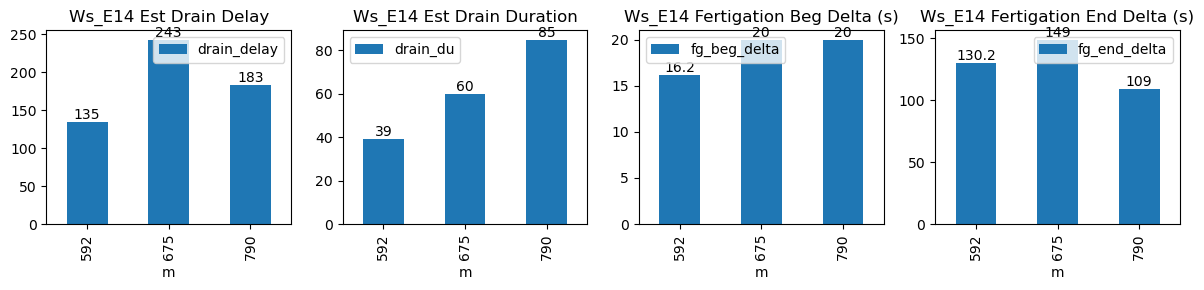
16.2 |
130.2 |
19.764 |
0.0 |
0 |
0.0 |
39 |
135 |
-0.016708 |
NaN |
NaN |
NaN |
| 2025-12-16 11:15:00+08:00 |
71 |
675 |
Ws_E14 |
0.265887 |
30 |
675.00 |
675.333333 |
675.60 |
678.083333 |
14339.2 |
14435.266667 |
36 |
-0.098240 |
-0.078872 |
-0.094609 |
0.264000 |
0.533704 |
19.213333 |
True |
20.0 |
149.0 |
19.764 |
0.0 |
0 |
0.0 |
60 |
243 |
-0.018267 |
NaN |
NaN |
NaN |
| 2025-12-16 13:10:00+08:00 |
71 |
790 |
Ws_E14 |
0.265887 |
30 |
790.00 |
790.333333 |
790.60 |
792.416667 |
14335.0 |
14432.800000 |
36 |
-0.085912 |
-0.073426 |
-0.087016 |
0.313571 |
0.543333 |
19.560000 |
True |
20.0 |
109.0 |
19.764 |
0.0 |
0 |
0.0 |
85 |
183 |
-0.020514 |
NaN |
NaN |
NaN |