| 2025-12-15 09:25:00+08:00 |
70 |
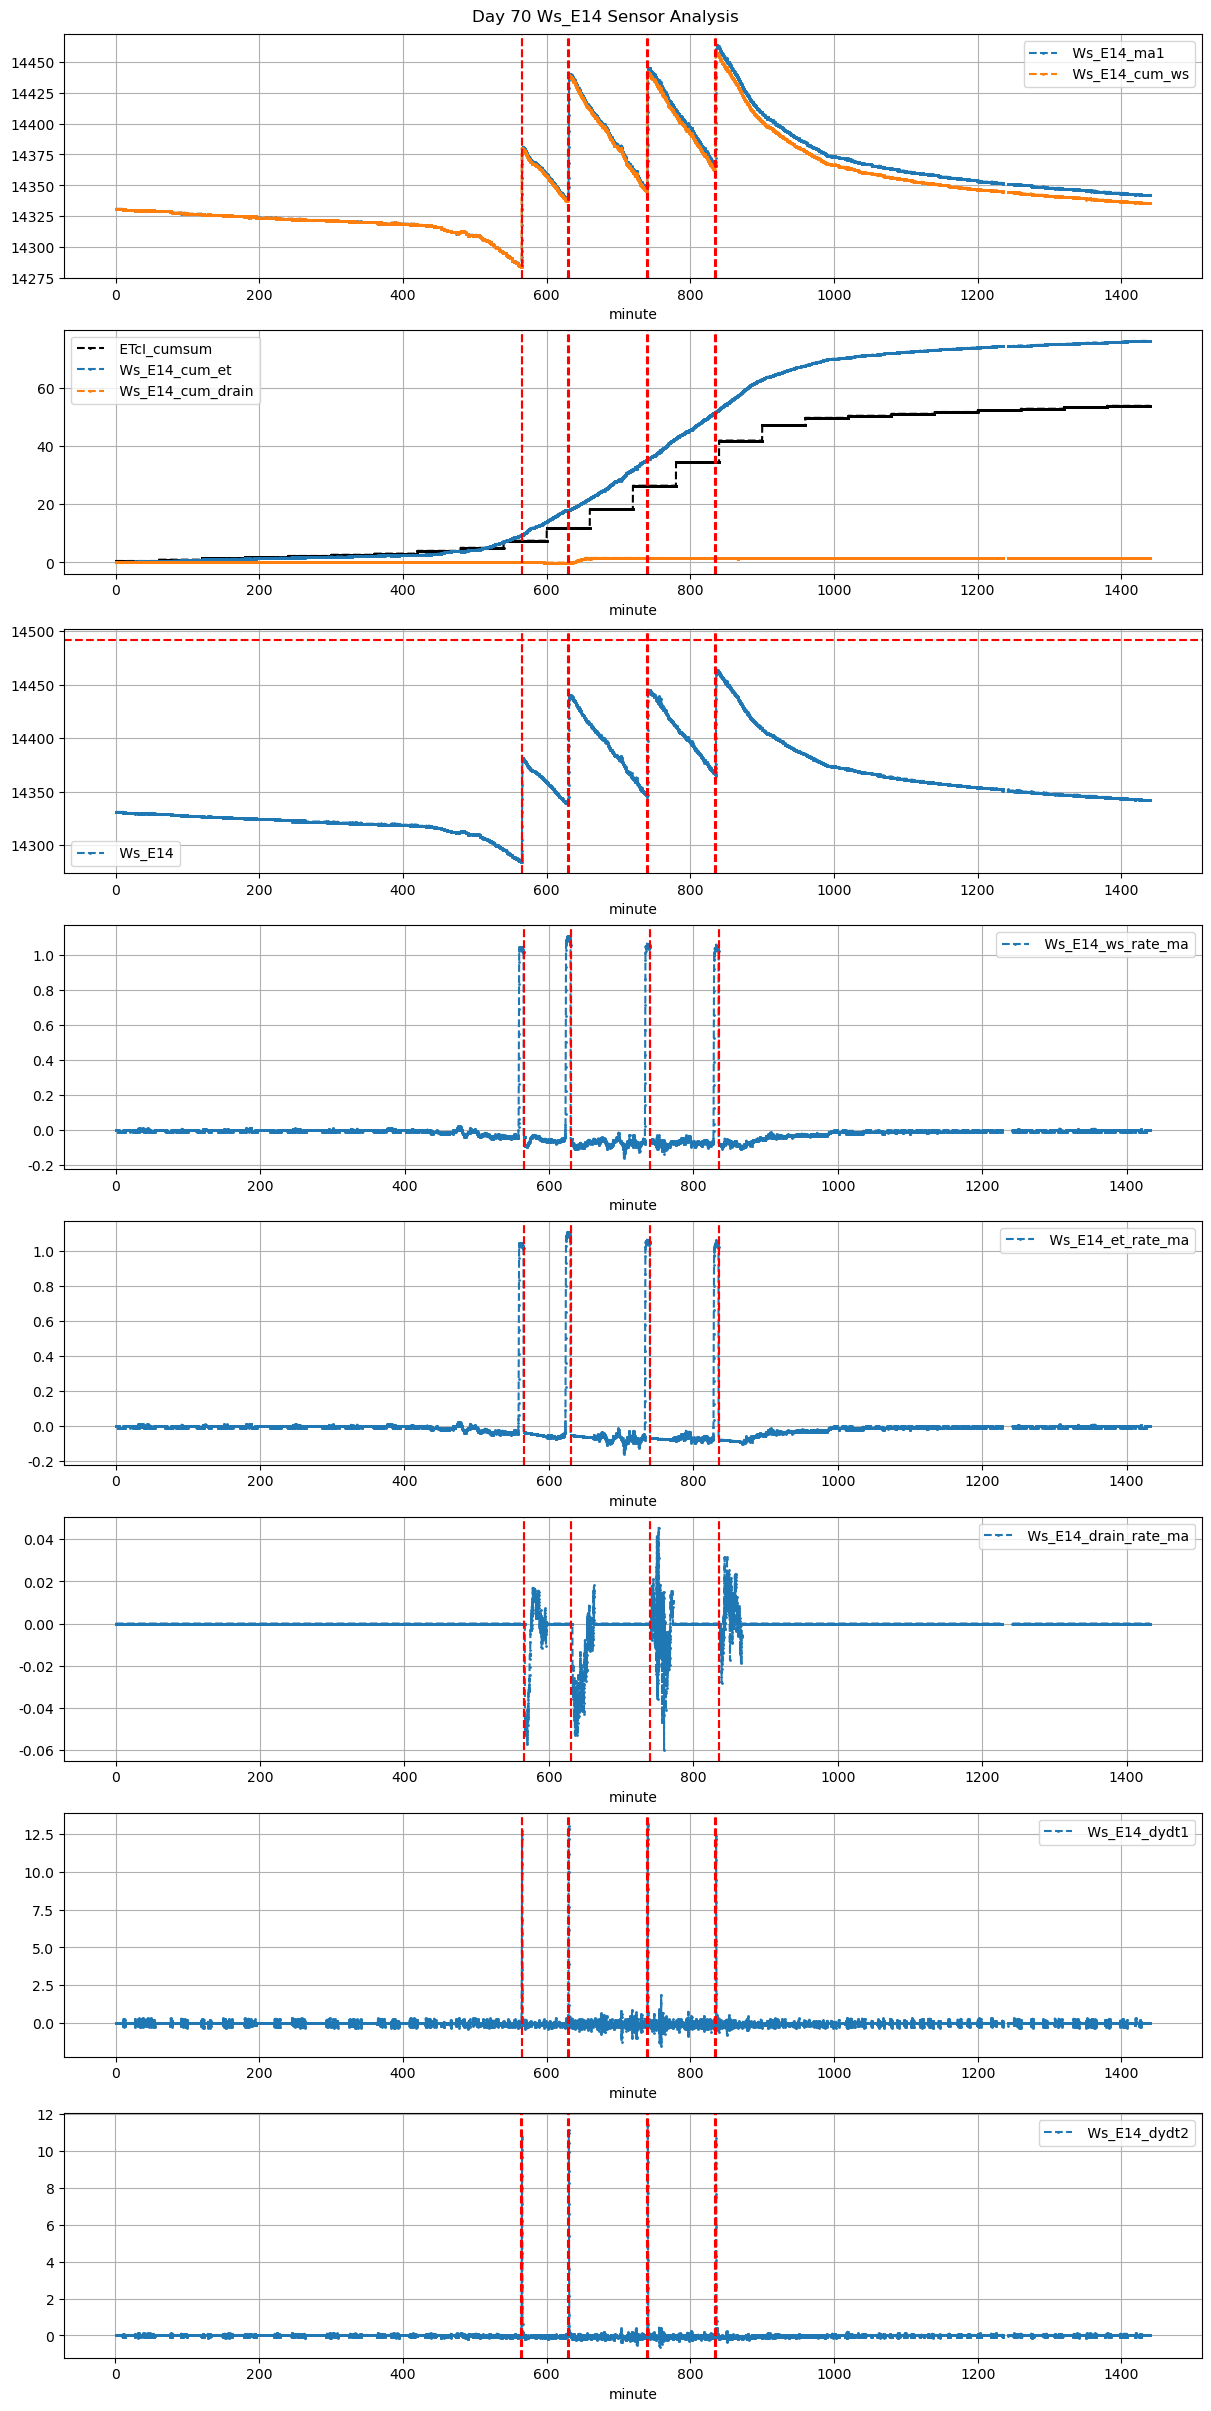
565 |
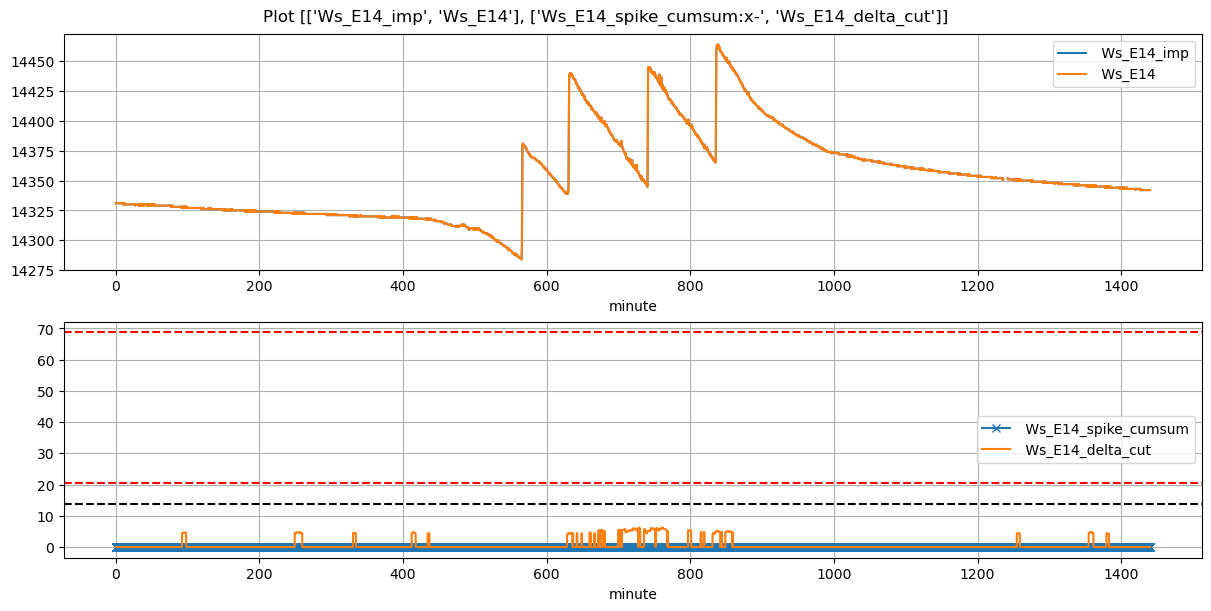
Ws_E14 |
0.248481 |
30 |
565.0 |
565.333333 |
565.6 |
566.666667 |
14285.000000 |
14381.000000 |
36 |
-0.036041 |
-0.078086 |
-0.056443 |
0.378571 |
0.533333 |
19.200000 |
True |
20.0 |
64.0 |
19.800000 |
0.0 |
0.0 |
0.0 |
505 |
78 |
-0.051631 |
NaN |
NaN |
NaN |
| 2025-12-15 10:30:00+08:00 |
70 |
630 |
Ws_E14 |
0.248481 |
30 |
630.0 |
630.333333 |
630.6 |
632.583333 |
14339.177778 |
14439.833333 |
36 |
-0.052555 |
-0.091157 |
-0.065679 |
0.312286 |
0.559198 |
20.131111 |
True |
20.0 |
119.0 |
20.131111 |
0.0 |
0.0 |
0.0 |
1080 |
269 |
-0.044415 |
NaN |
NaN |
NaN |
| 2025-12-15 12:20:00+08:00 |
70 |
740 |
Ws_E14 |
0.248481 |
30 |
740.0 |
740.333333 |
740.6 |
741.833333 |
14347.560000 |
14445.000000 |
36 |
-0.069413 |
-0.067654 |
-0.077387 |
0.384429 |
0.541333 |
19.488000 |
True |
20.0 |
74.0 |
19.800000 |
0.0 |
0.0 |
0.0 |
120 |
563 |
-0.030824 |
NaN |
NaN |
NaN |
| 2025-12-15 13:55:00+08:00 |
70 |
835 |
Ws_E14 |
0.248481 |
30 |
835.0 |
835.333333 |
835.6 |
837.166667 |
14367.000000 |
14463.500000 |
36 |
-0.076519 |
-0.080988 |
-0.088871 |
0.339571 |
0.536111 |
19.300000 |
True |
20.0 |
94.0 |
19.800000 |
0.0 |
0.0 |
0.0 |
189 |
194 |
-0.014397 |
NaN |
NaN |
NaN |