| 2025-12-31 09:50:00+08:00 |
86 |
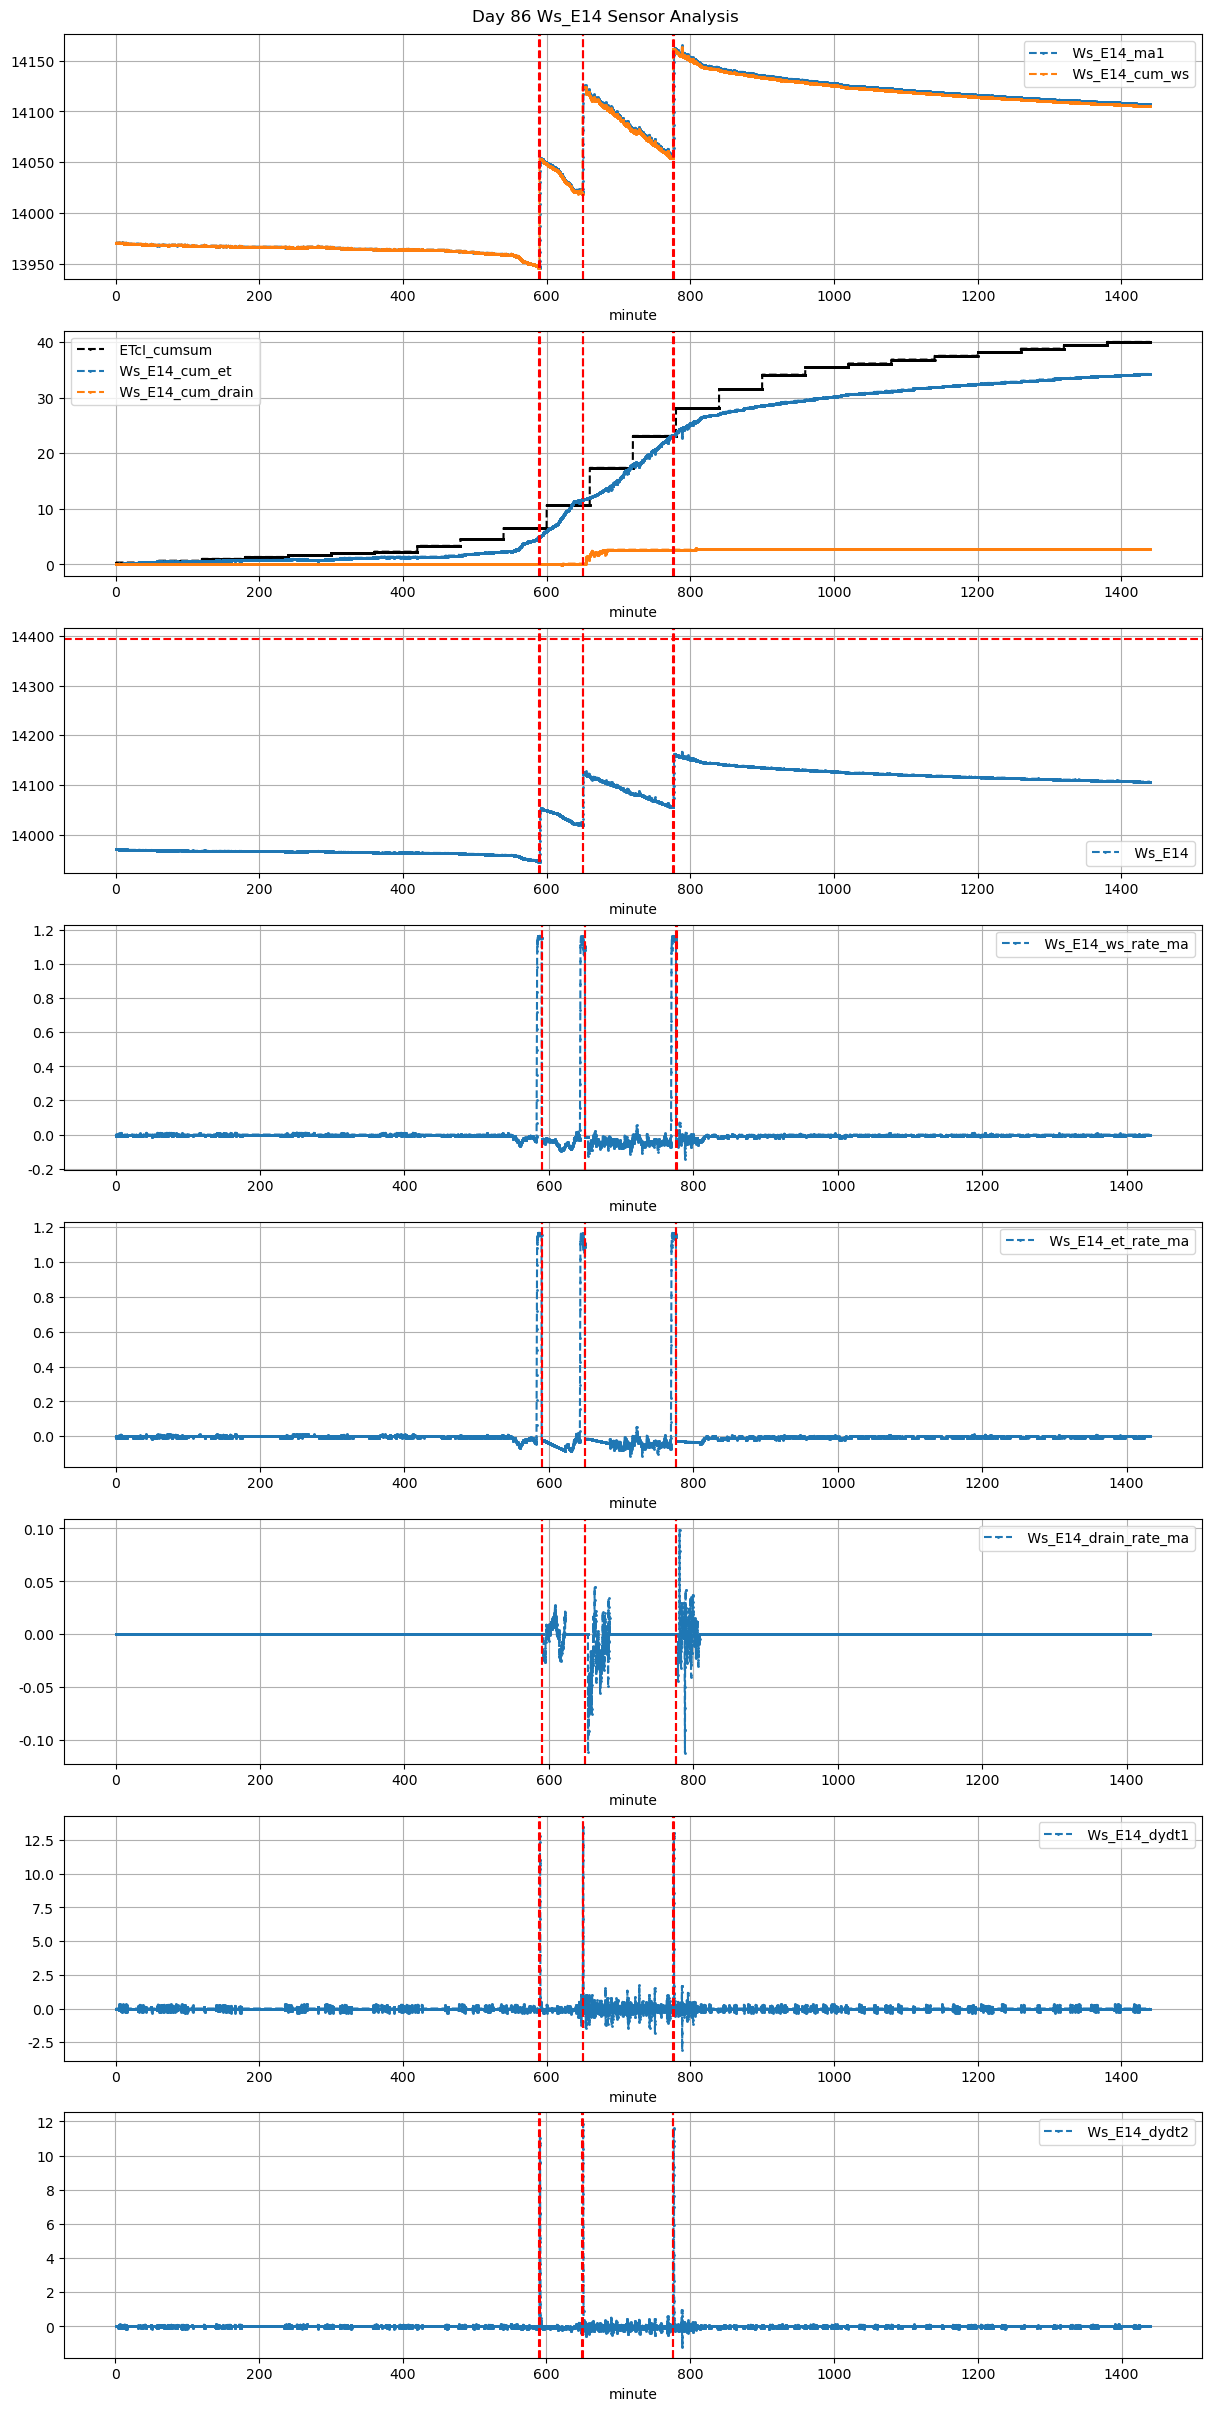
590 |
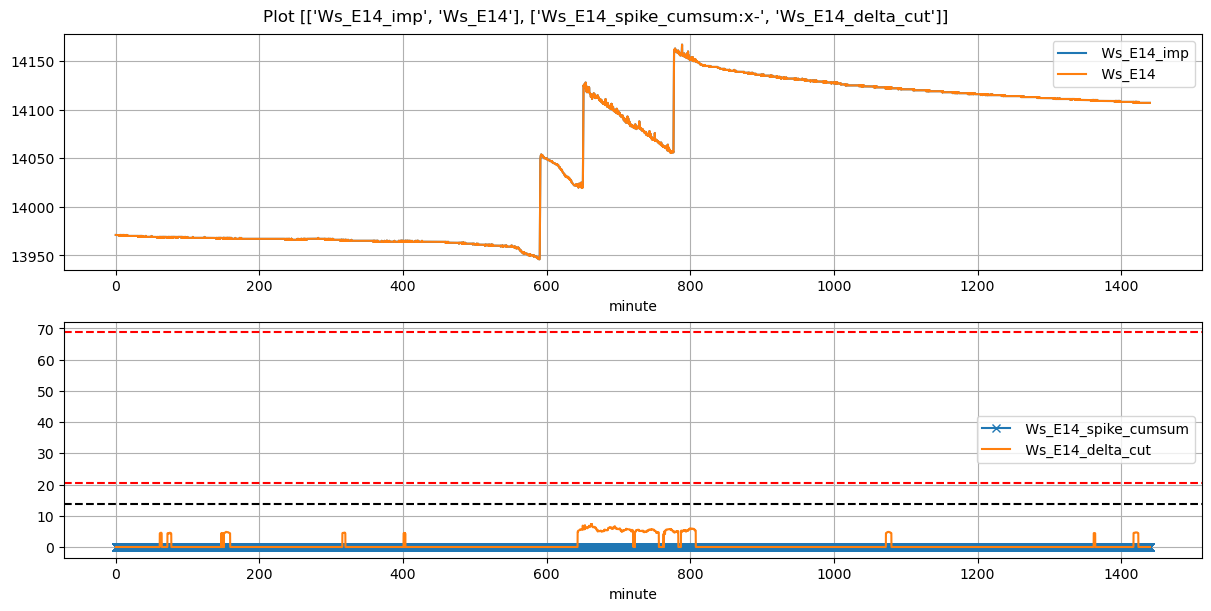
Ws_E14 |
0.262445 |
30 |
590.00 |
590.333333 |
590.62 |
592.583333 |
13946.690909 |
14053.857143 |
37 |
-0.023283 |
-0.037210 |
-0.082619 |
0.324714 |
0.579277 |
21.433247 |
True |
20.0 |
117.8 |
21.433247 |
0.0 |
0.0 |
0.0 |
205 |
137 |
-0.024241 |
NaN |
NaN |
NaN |
| 2025-12-31 10:50:00+08:00 |
86 |
650 |
Ws_E14 |
0.262445 |
30 |
650.00 |
650.416667 |
650.62 |
654.166667 |
14020.866667 |
14125.833333 |
37 |
-0.013795 |
-0.060895 |
-0.040843 |
0.207857 |
0.567387 |
20.993333 |
True |
25.0 |
212.8 |
20.993333 |
0.0 |
0.0 |
0.0 |
429 |
217 |
-0.065629 |
NaN |
NaN |
NaN |
| 2025-12-31 12:56:05+08:00 |
86 |
776 |
Ws_E14 |
0.262445 |
30 |
776.08 |
776.500000 |
776.70 |
778.750000 |
14056.000000 |
14162.500000 |
37 |
-0.044547 |
-0.027840 |
-0.035013 |
0.334714 |
0.575676 |
21.300000 |
True |
25.2 |
123.0 |
21.300000 |
0.0 |
0.0 |
0.0 |
94 |
127 |
-0.038607 |
NaN |
NaN |
NaN |