VI and VO Daily Summary
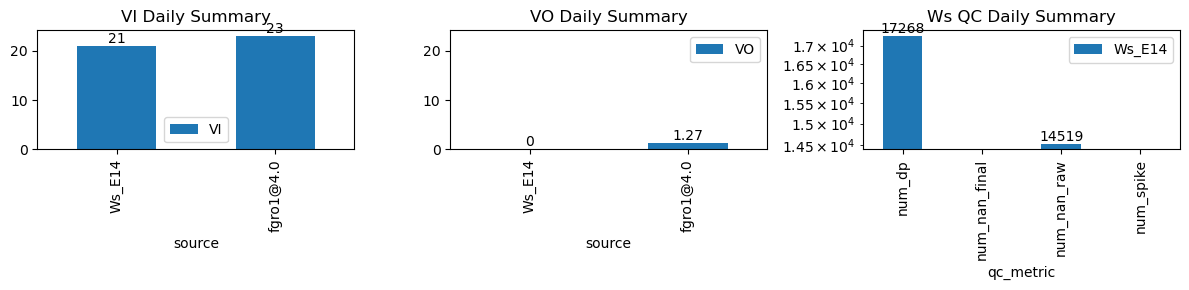
| ws_name | num_dp | num_nan_raw | num_nan_final | num_spike | cum_step_adj |
|---|---|---|---|---|---|
| Ws_E14 | 17,268 | 14,519 | 0 | 0 | 0.00 |
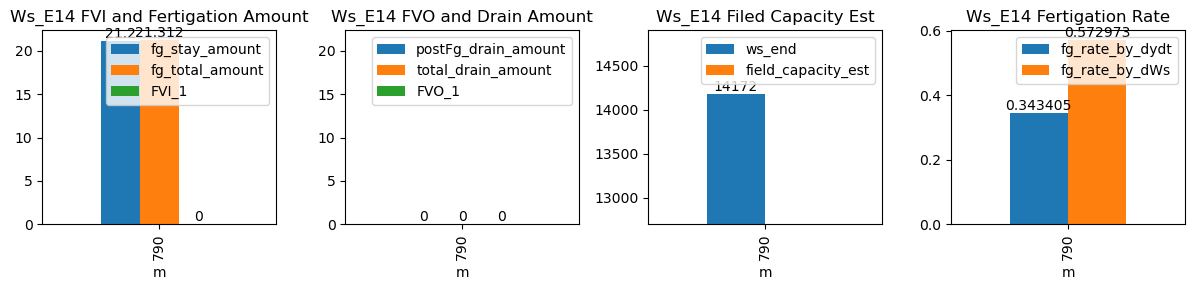
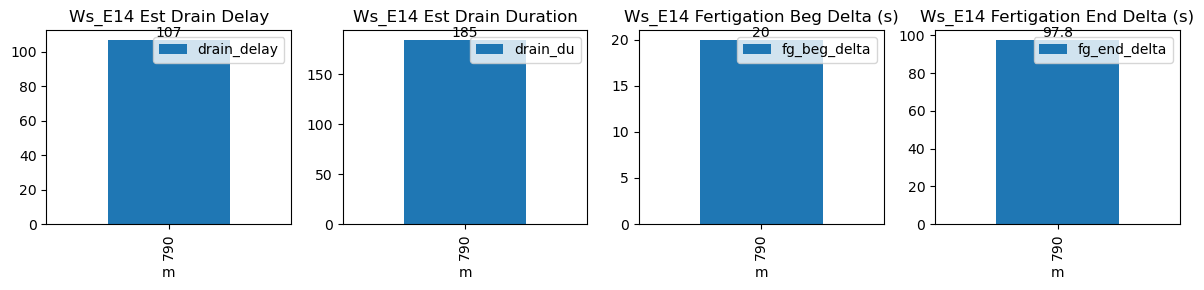
| ds | d | m | ws_name | prominence_cut | max_drain_du | fg_beg | fg_beg_est | fg_end | fg_end_est | ws_beg | ws_end | duc | pre_fg_et | post_fg_ws | post_drn_et | fg_rate_by_dydt | fg_rate_by_dWs | fg_stay_amount | enough_data | fg_beg_delta | fg_end_delta | fg_total_amount | fg_drain_amount | postFg_drain_amount | total_drain_amount | drain_du | drain_delay | drain_rate | field_capacity_est | FVI_1 | FVO_1 |
|---|---|---|---|---|---|---|---|---|---|---|---|---|---|---|---|---|---|---|---|---|---|---|---|---|---|---|---|---|---|---|---|
| 2026-01-01 13:10:00+08:00 | 87 | 790 | Ws_E14 | 0.139043 | 30 | 790.0 | 790.333333 | 790.62 | 792.166667 | 14066.0 | 14172.0 | 37 | -0.004308 | -0.020868 | -0.015093 | 0.343857 | 0.572973 | 21.2 | True | 20.0 | 92.8 | 21.312 | 0.0 | 0 | 0.0 | 9 | 762 | -0.268988 | NaN | NaN | NaN |