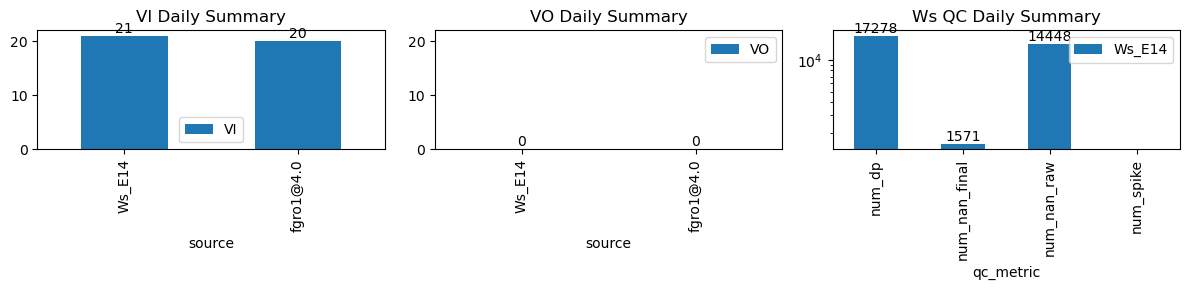
VI and VO Daily Summary
| ws_name | num_dp | num_nan_raw | num_nan_final | num_spike | cum_step_adj |
|---|---|---|---|---|---|
| Ws_E14 | 17,278 | 14,448 | 1,571 | 0 | 0.00 |
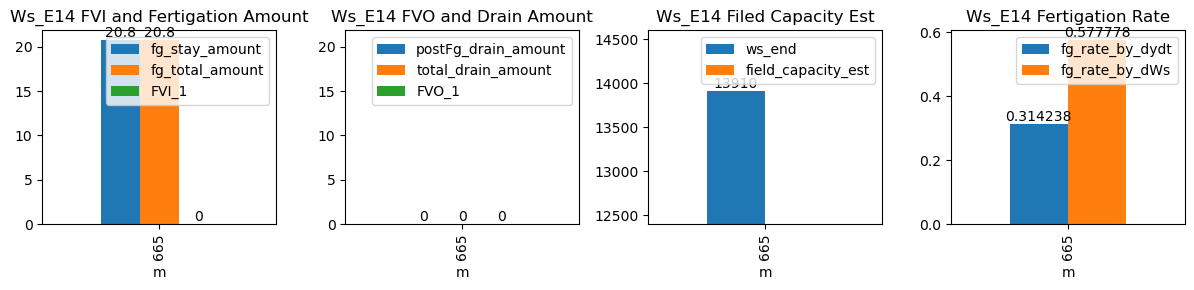
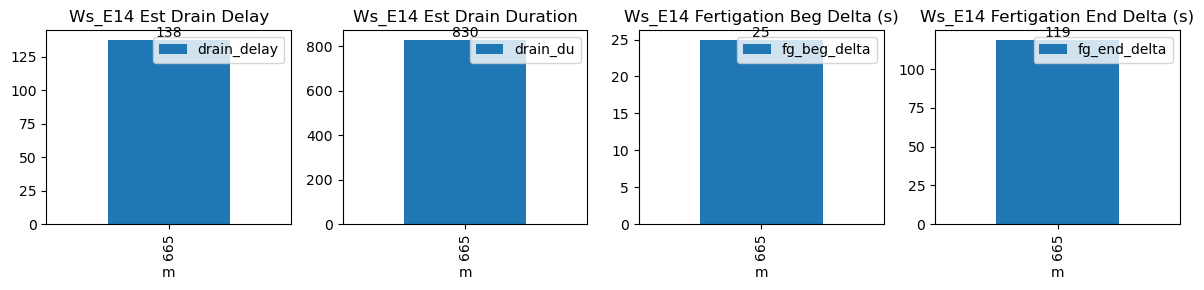
| ds | d | m | ws_name | prominence_cut | max_drain_du | fg_beg | fg_beg_est | fg_end | fg_end_est | ws_beg | ws_end | duc | pre_fg_et | post_fg_ws | post_drn_et | fg_rate_by_dydt | fg_rate_by_dWs | fg_stay_amount | enough_data | fg_beg_delta | fg_end_delta | fg_total_amount | fg_drain_amount | postFg_drain_amount | total_drain_amount | drain_du | drain_delay | drain_rate | field_capacity_est | FVI_1 | FVO_1 |
|---|---|---|---|---|---|---|---|---|---|---|---|---|---|---|---|---|---|---|---|---|---|---|---|---|---|---|---|---|---|---|---|
| 2025-12-22 11:05:00+08:00 | 77 | 665 | Ws_E14 | 0.205544 | 30 | 665.0 | 665.416667 | 665.6 | 667.583333 | 13806.0 | 13910.0 | 36 | -0.006991 | -0.025975 | -0.017037 | 0.314238 | 0.577778 | 20.8 | True | 25.0 | 119.0 | 20.8 | 0.0 | 0 | 0.0 | 830 | 138 | -0.025913 | NaN | NaN | NaN |