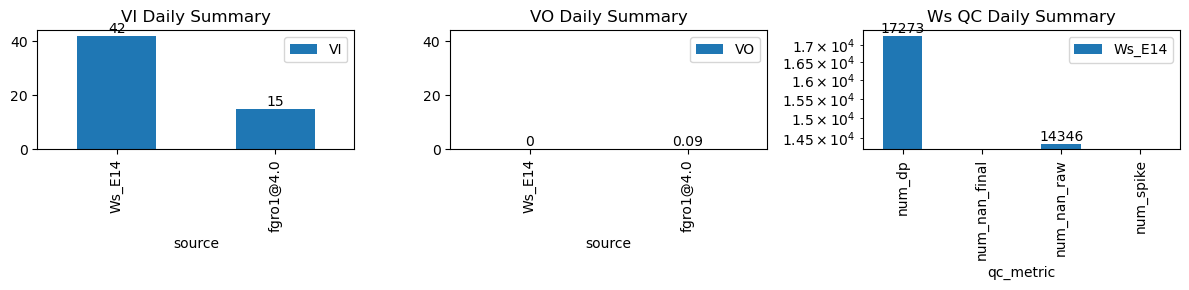
VI and VO Daily Summary
| ws_name | num_dp | num_nan_raw | num_nan_final | num_spike | cum_step_adj |
|---|---|---|---|---|---|
| Ws_E14 | 17,273 | 14,346 | 0 | 0 | 0.00 |
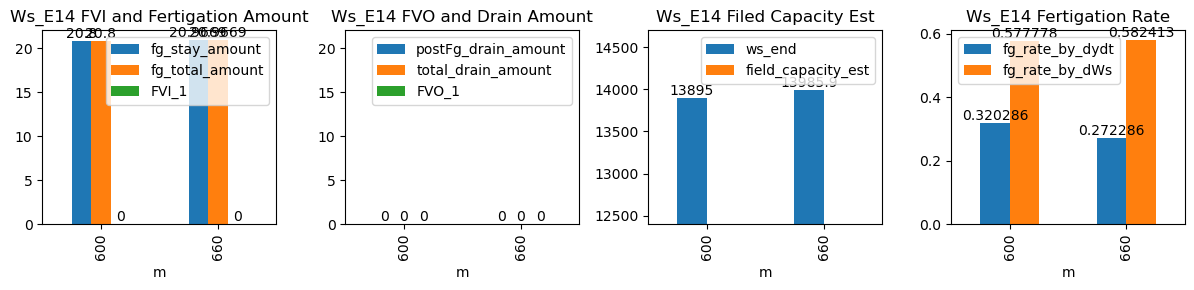
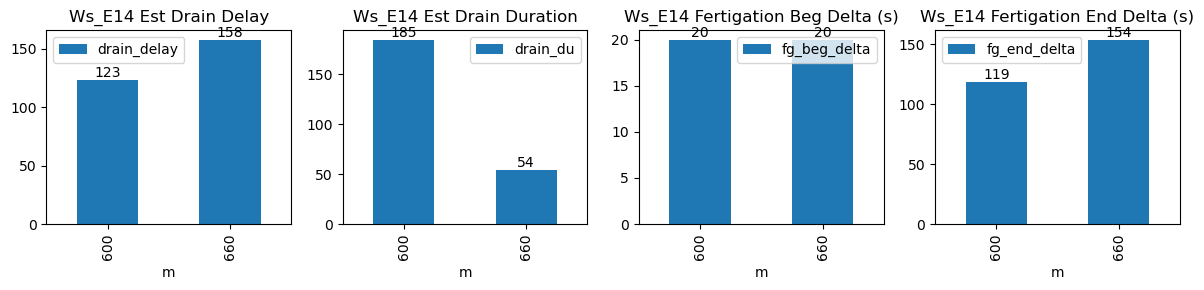
| ds | d | m | ws_name | prominence_cut | max_drain_du | fg_beg | fg_beg_est | fg_end | fg_end_est | ws_beg | ws_end | duc | pre_fg_et | post_fg_ws | post_drn_et | fg_rate_by_dydt | fg_rate_by_dWs | fg_stay_amount | enough_data | fg_beg_delta | fg_end_delta | fg_total_amount | fg_drain_amount | postFg_drain_amount | total_drain_amount | drain_du | drain_delay | drain_rate | field_capacity_est | FVI_1 | FVO_1 |
|---|---|---|---|---|---|---|---|---|---|---|---|---|---|---|---|---|---|---|---|---|---|---|---|---|---|---|---|---|---|---|---|
| 2025-12-23 10:00:00+08:00 | 78 | 600 | Ws_E14 | 0.169864 | 30 | 600.0 | 600.333333 | 600.6 | 602.583333 | 13791.000000 | 13895.000000 | 36 | -0.012474 | -0.007319 | -0.020247 | 0.320286 | 0.577778 | 20.800000 | True | 20.0 | 119.0 | 20.800000 | 0.0 | 0 | 0.0 | 185 | 123 | -0.014718 | NaN | NaN | NaN |
| 2025-12-23 11:00:00+08:00 | 78 | 660 | Ws_E14 | 0.169864 | 30 | 660.0 | 660.333333 | 660.6 | 663.166667 | 13881.054545 | 13985.888889 | 36 | -0.027247 | -0.018522 | -0.014306 | 0.272286 | 0.582413 | 20.966869 | True | 20.0 | 154.0 | 20.966869 | 0.0 | 0 | 0.0 | 54 | 158 | -0.015837 | NaN | NaN | NaN |