VI and VO Daily Summary
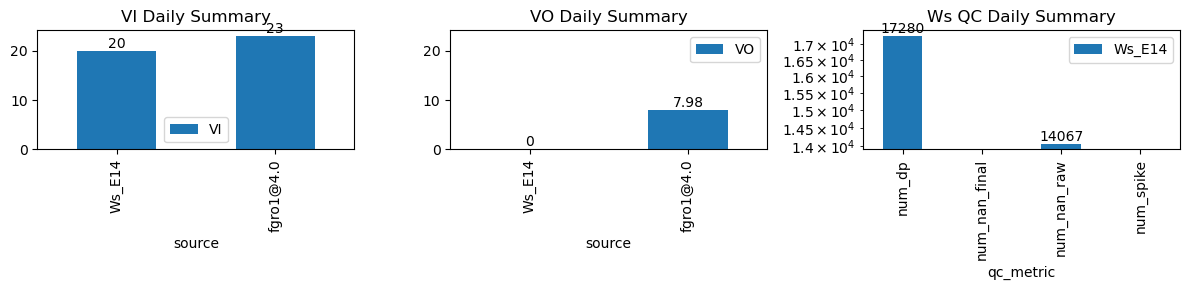
| ws_name | num_dp | num_nan_raw | num_nan_final | num_spike | cum_step_adj |
|---|---|---|---|---|---|
| Ws_E14 | 17,280 | 14,067 | 0 | 0 | 0.00 |
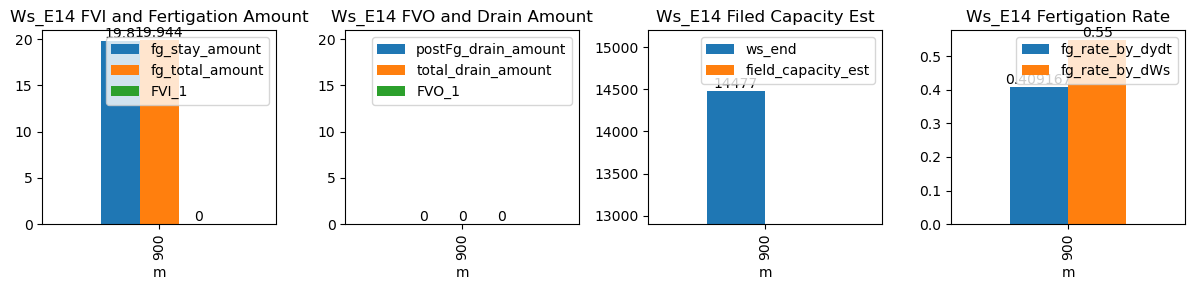
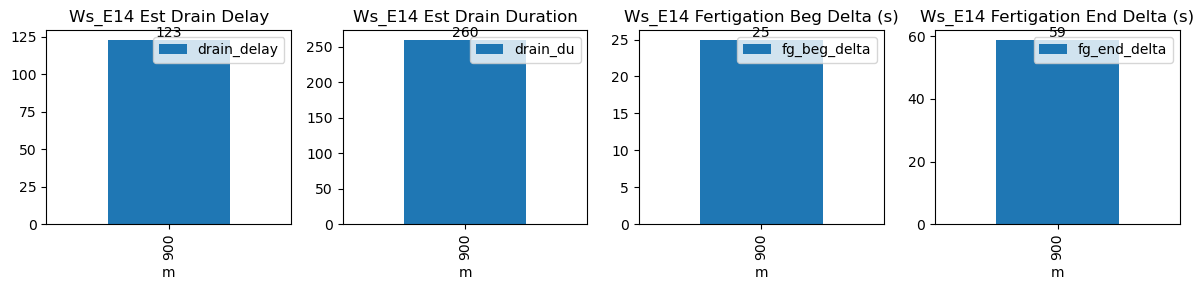
| ds | d | m | ws_name | prominence_cut | max_drain_du | fg_beg | fg_beg_est | fg_end | fg_end_est | ws_beg | ws_end | duc | pre_fg_et | post_fg_ws | post_drn_et | fg_rate_by_dydt | fg_rate_by_dWs | fg_stay_amount | enough_data | fg_beg_delta | fg_end_delta | fg_total_amount | fg_drain_amount | postFg_drain_amount | total_drain_amount | drain_du | drain_delay | drain_rate | field_capacity_est | FVI_1 | FVO_1 |
|---|---|---|---|---|---|---|---|---|---|---|---|---|---|---|---|---|---|---|---|---|---|---|---|---|---|---|---|---|---|---|---|
| 2025-12-13 15:00:00+08:00 | 68 | 900 | Ws_E14 | 0.169488 | 30 | 900.0 | 900.416667 | 900.6 | 901.583333 | 14378.0 | 14477.0 | 36 | -0.003229 | -0.018642 | -0.00037 | 0.409167 | 0.55 | 19.8 | True | 25.0 | 59.0 | 19.944 | 0.0 | 0 | 0.0 | 260 | 123 | -0.024352 | NaN | NaN | NaN |