| 2025-12-12 09:35:00+08:00 |
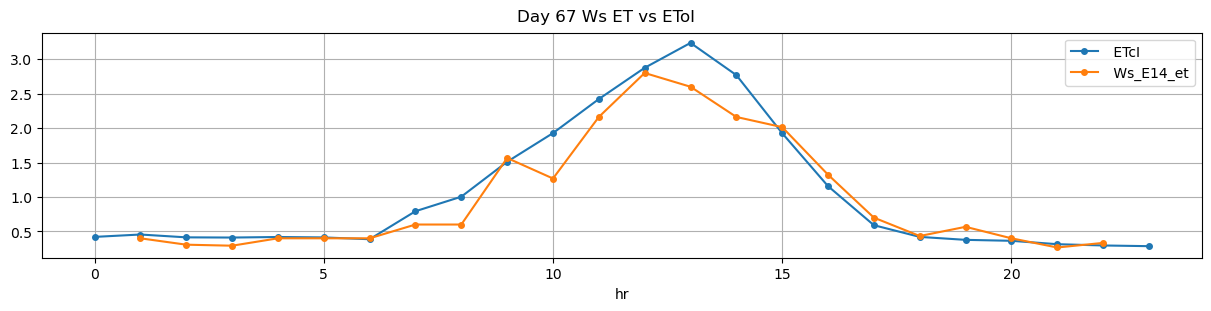
67 |
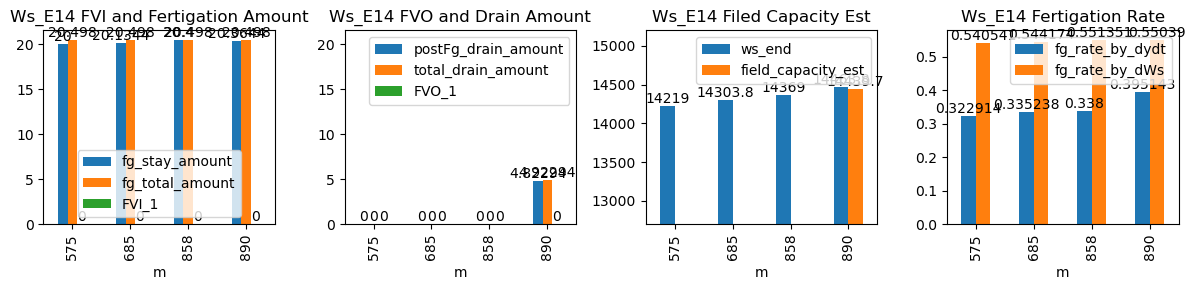
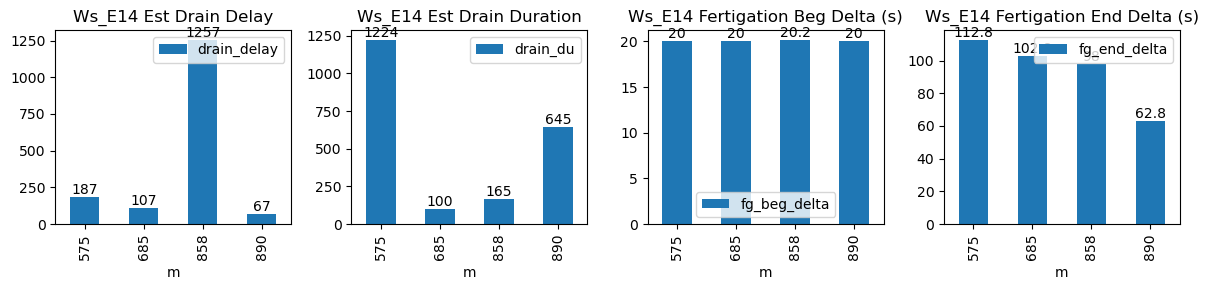
575 |
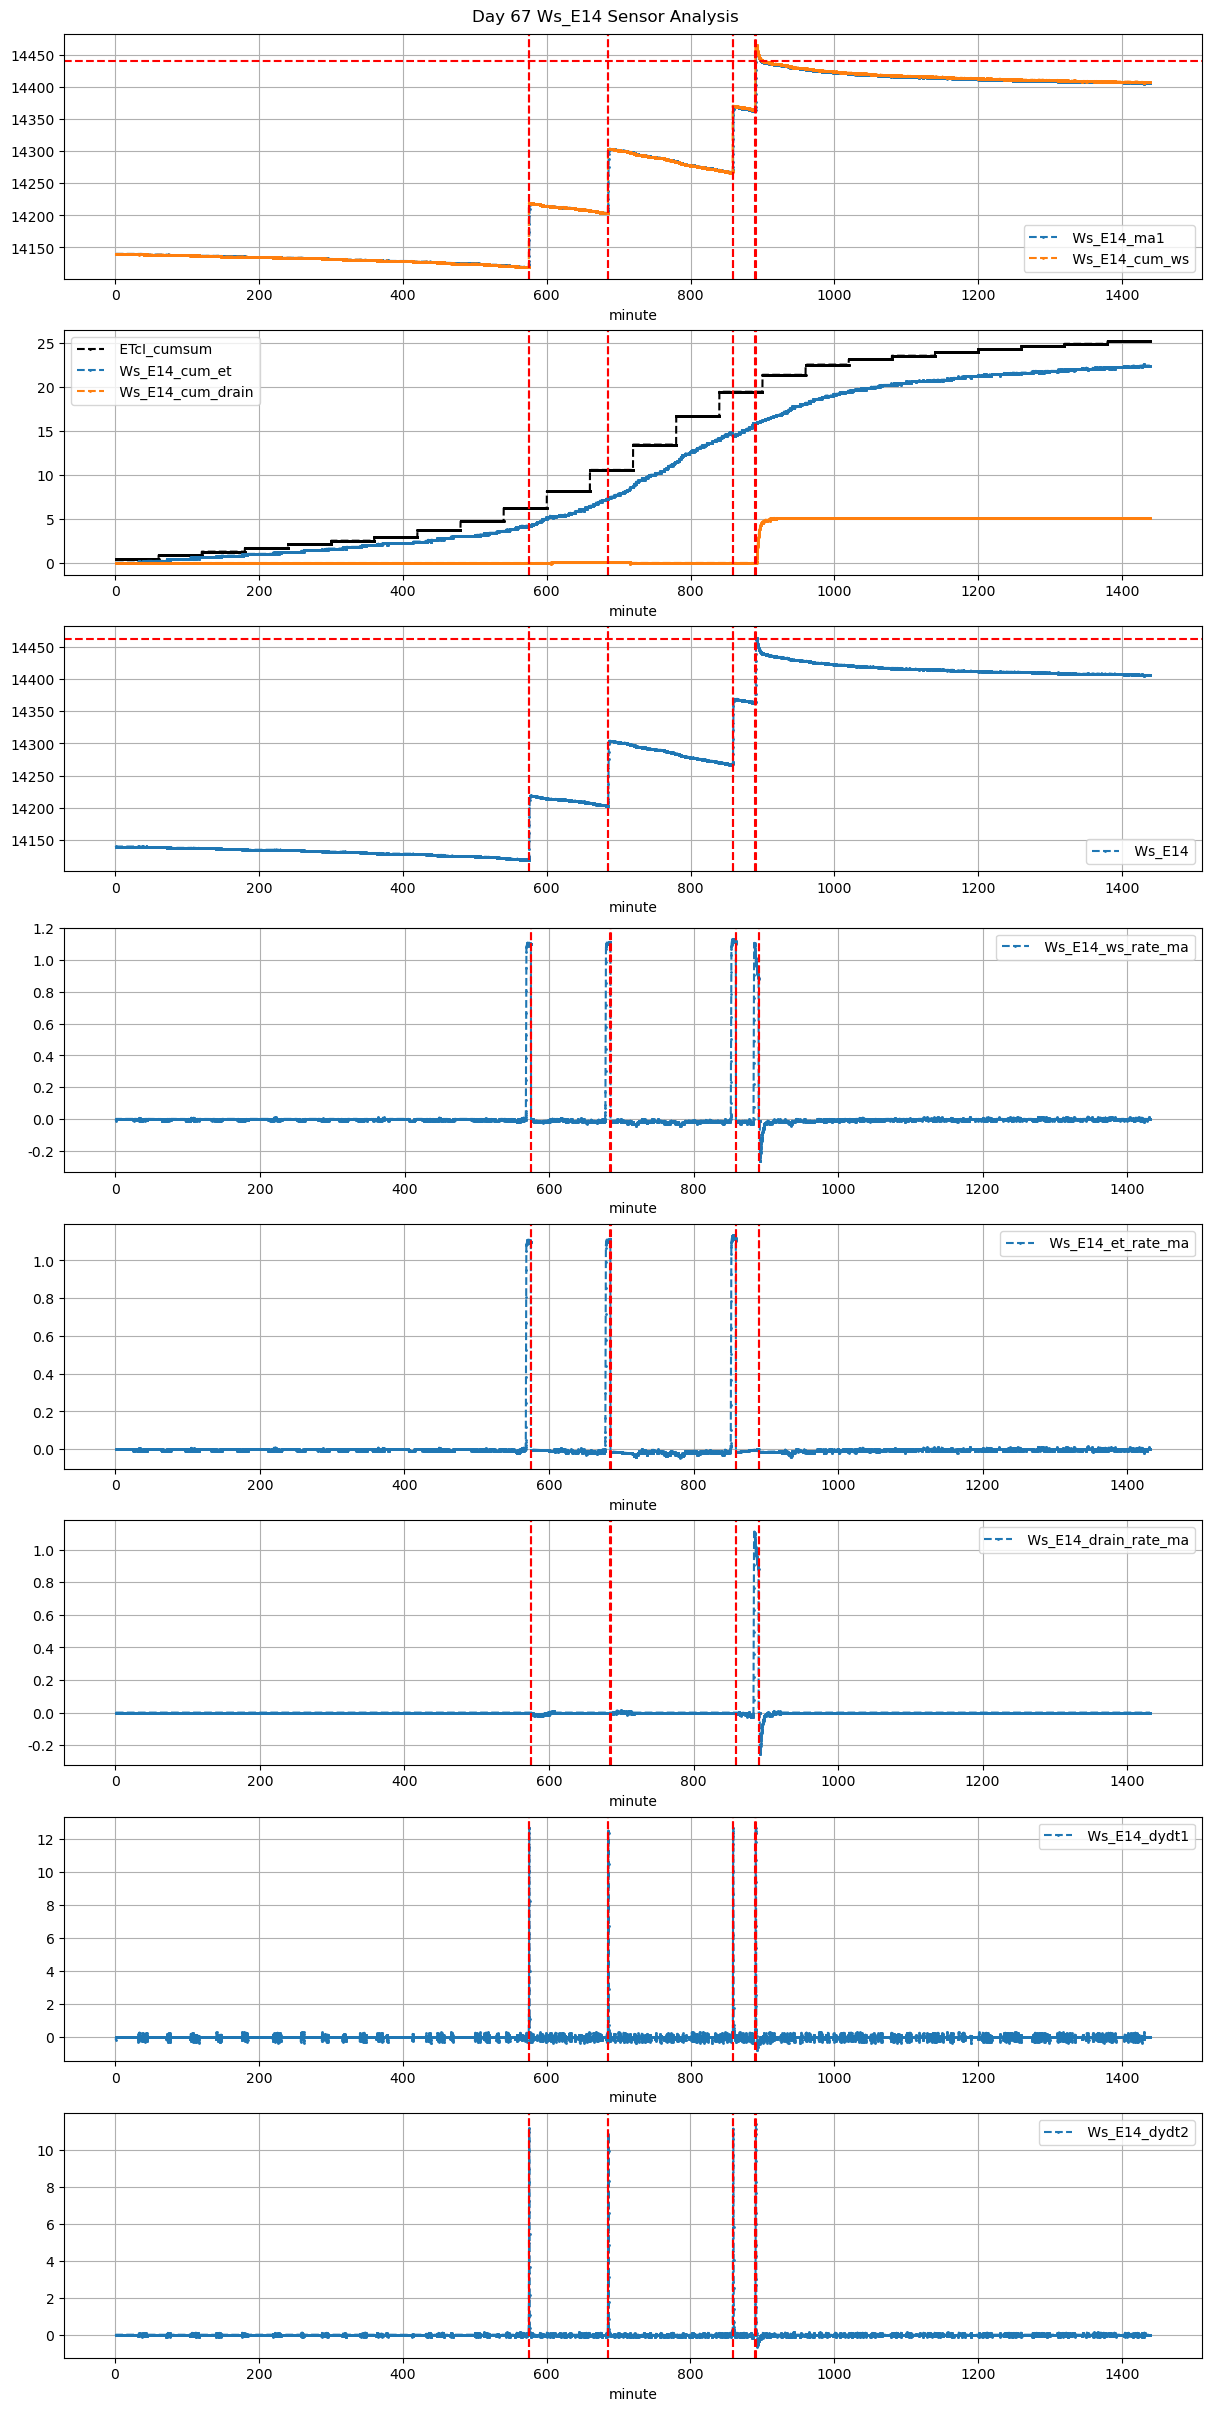
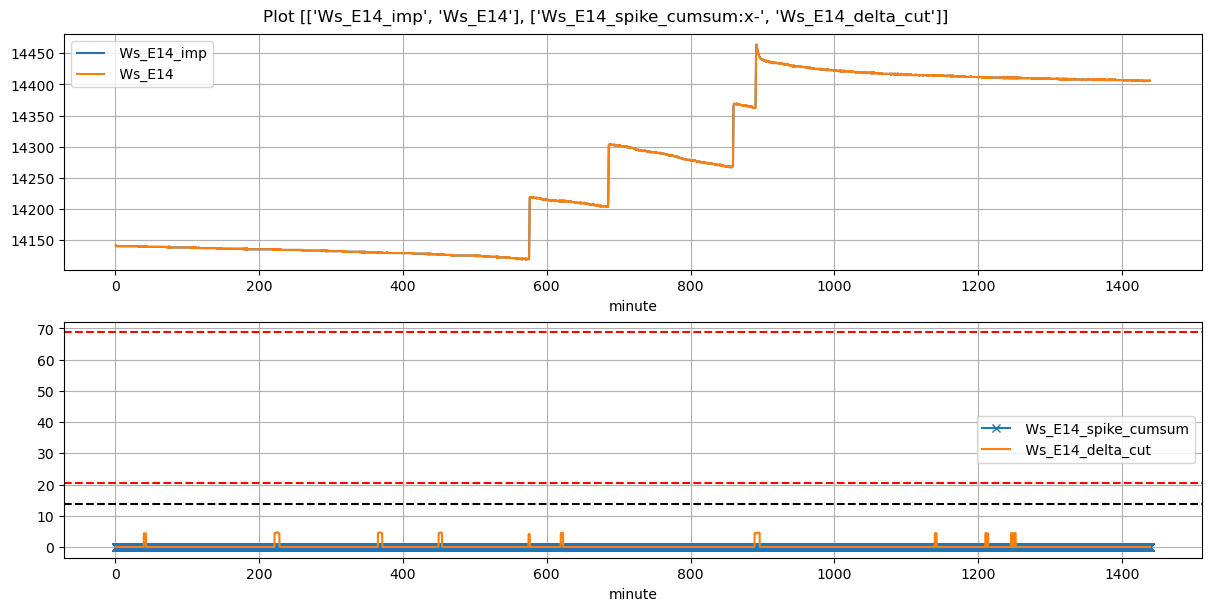
Ws_E14 |
0.195664 |
30.000000 |
575.00 |
575.333333 |
575.62 |
577.500000 |
14119.00 |
14219.000000 |
37 |
-0.001816 |
-0.014444 |
-0.008086 |
0.322914 |
0.540541 |
20.000000 |
True |
20.0 |
112.8 |
20.498 |
0.0 |
0.000000 |
0.000000 |
1224 |
187 |
-0.018299 |
NaN |
NaN |
NaN |
| 2025-12-12 11:25:00+08:00 |
67 |
685 |
Ws_E14 |
0.195664 |
30.000000 |
685.00 |
685.333333 |
685.62 |
687.333333 |
14203.15 |
14303.822222 |
37 |
-0.011923 |
-0.013354 |
-0.023086 |
0.335238 |
0.544174 |
20.134444 |
True |
20.0 |
102.8 |
20.498 |
0.0 |
0.000000 |
0.000000 |
100 |
107 |
-0.009027 |
NaN |
NaN |
NaN |
| 2025-12-12 14:18:35+08:00 |
67 |
858 |
Ws_E14 |
0.195664 |
29.166667 |
858.58 |
858.916667 |
859.20 |
860.833333 |
14267.00 |
14369.000000 |
37 |
-0.013815 |
-0.019383 |
0.000000 |
0.338000 |
0.551351 |
20.400000 |
True |
20.2 |
98.0 |
20.498 |
0.0 |
0.000000 |
0.000000 |
165 |
1257 |
-0.028676 |
NaN |
NaN |
NaN |
| 2025-12-12 14:50:00+08:00 |
67 |
890 |
Ws_E14 |
0.195664 |
30.000000 |
890.00 |
890.333333 |
890.62 |
891.666667 |
14362.00 |
14463.822222 |
37 |
-0.013372 |
-0.108930 |
-0.011605 |
0.395143 |
0.550390 |
20.364444 |
True |
20.0 |
62.8 |
20.498 |
0.1 |
4.822936 |
4.922936 |
645 |
67 |
-0.188696 |
14439.707542 |
NaN |
NaN |