| 2025-12-02 09:20:00+08:00 |
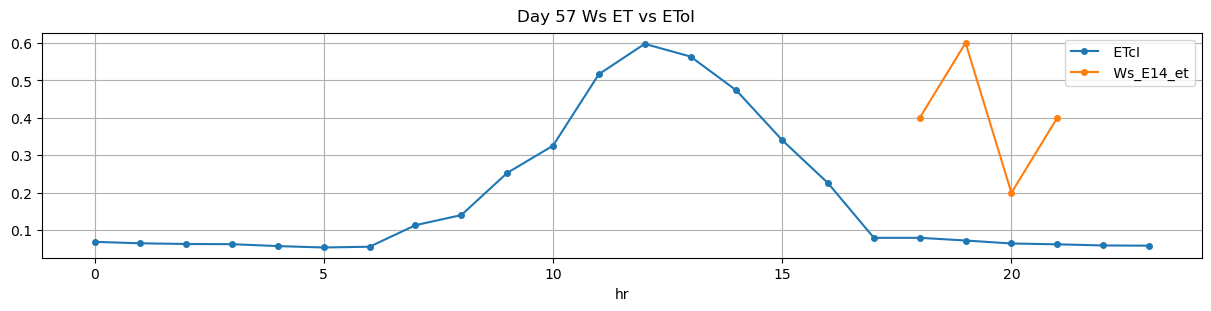
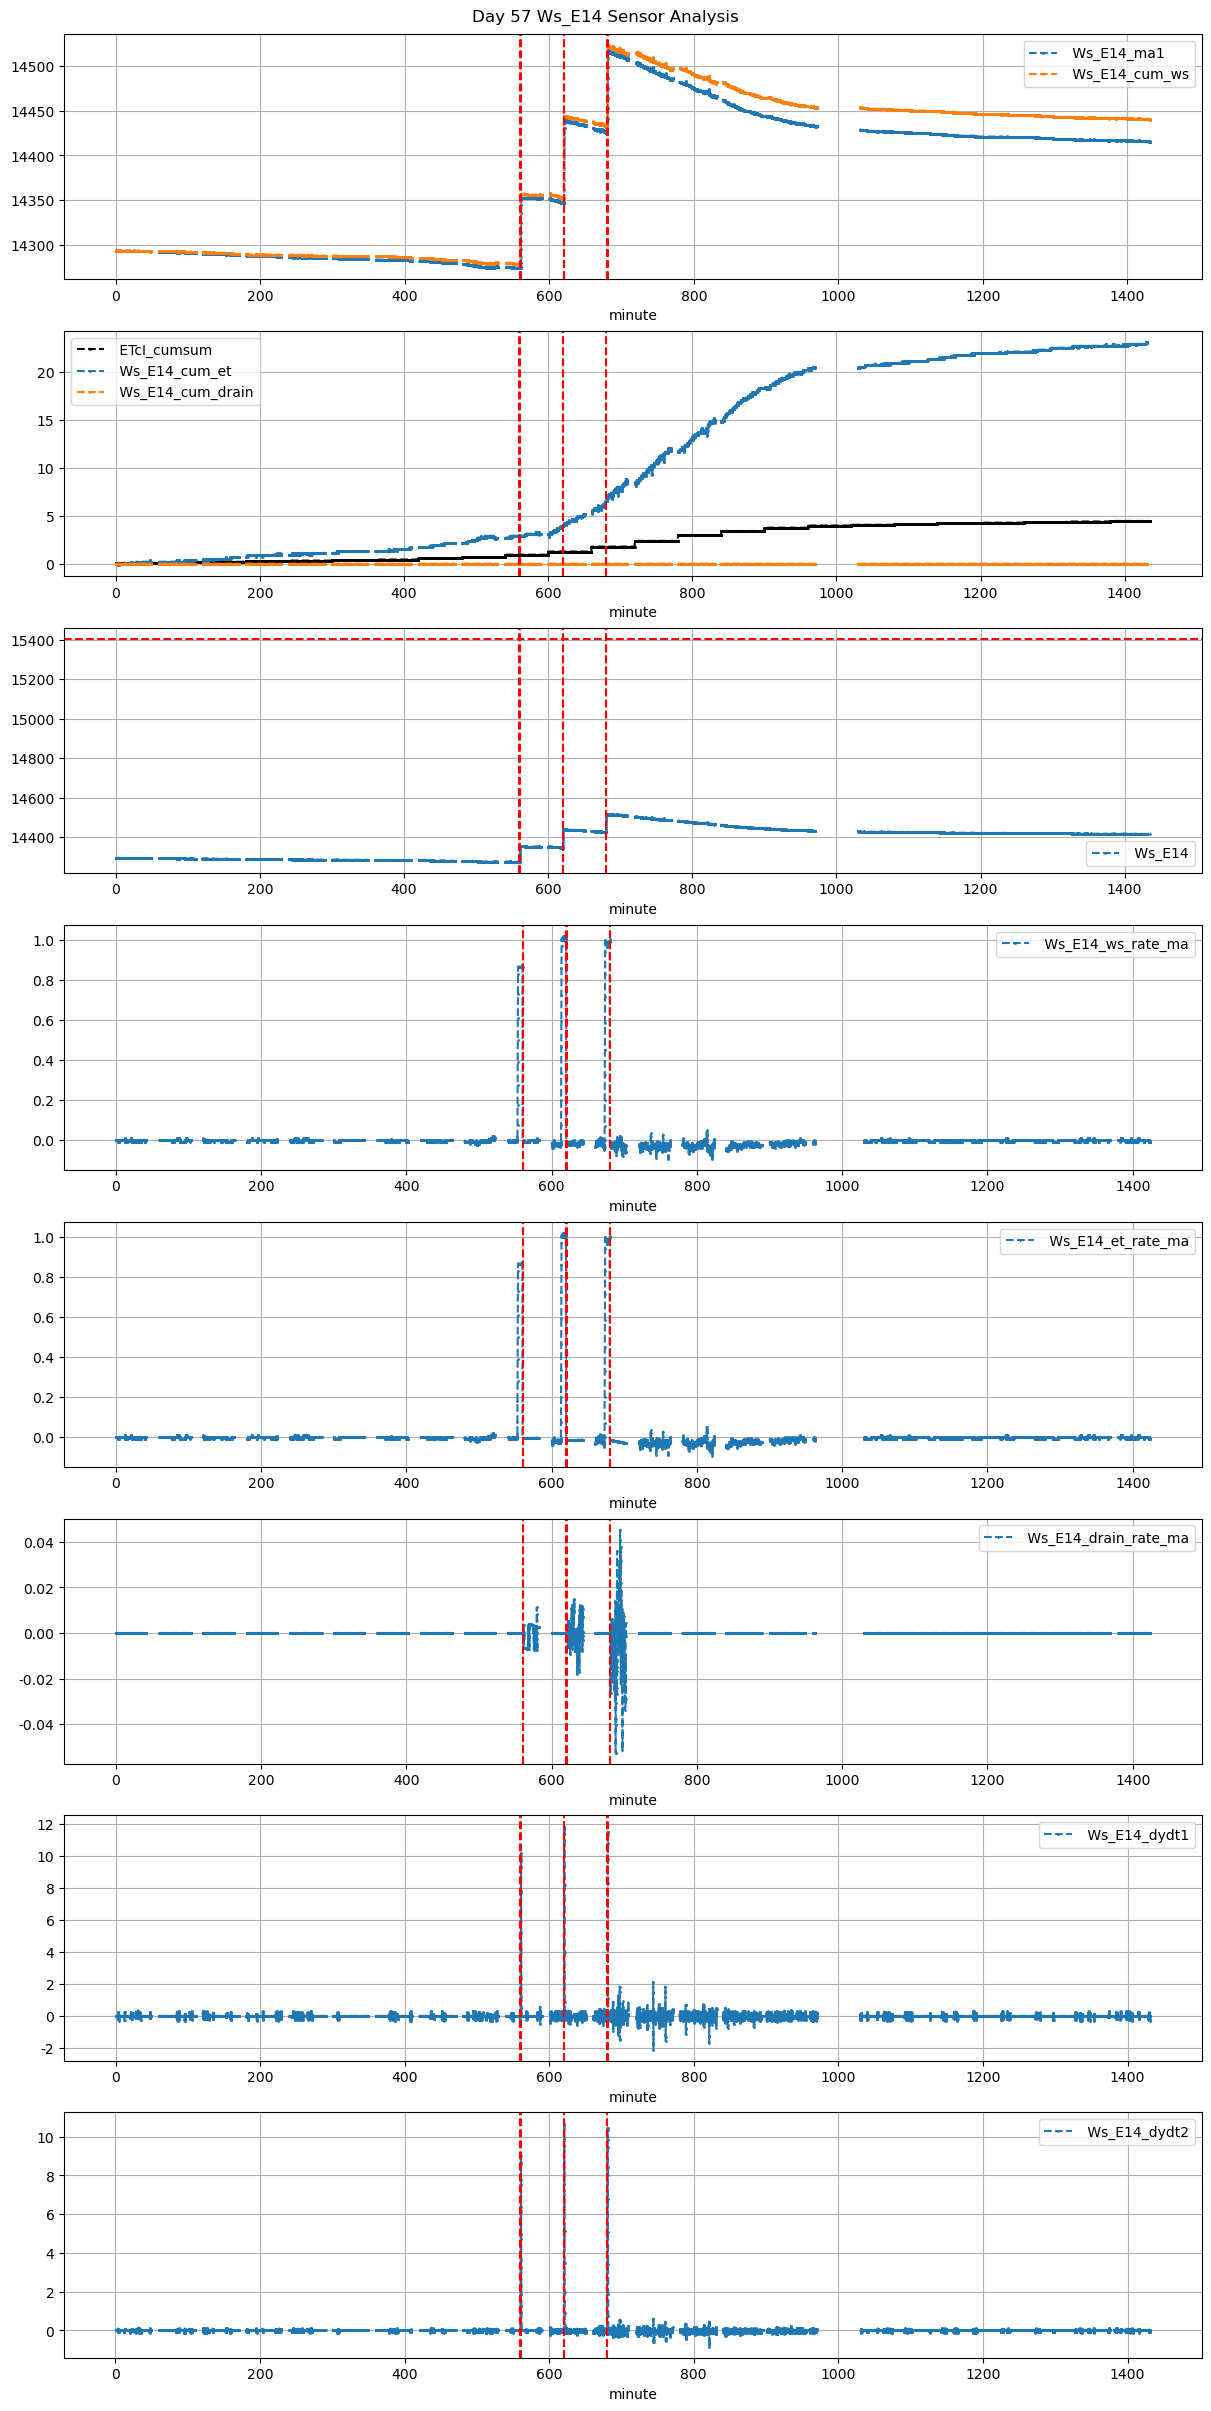
57 |
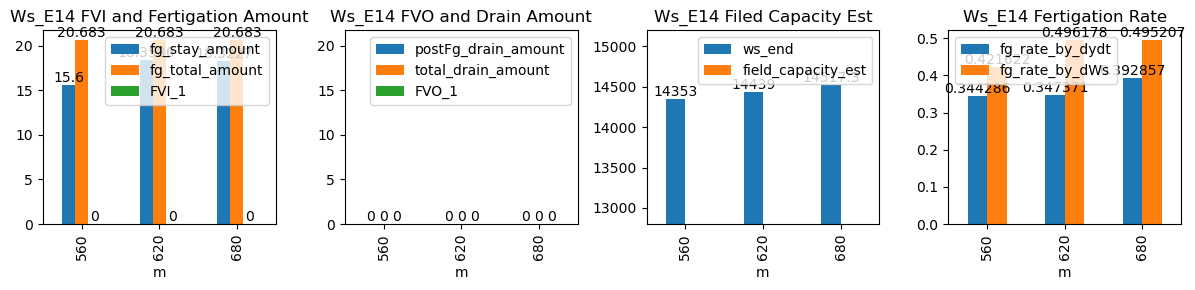
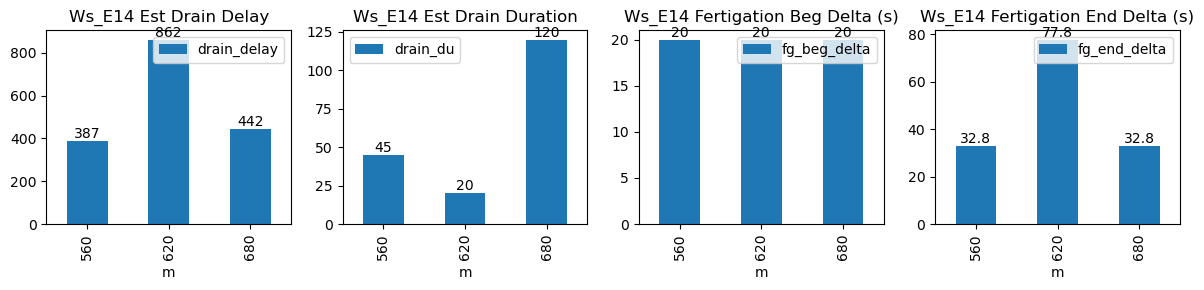
560 |
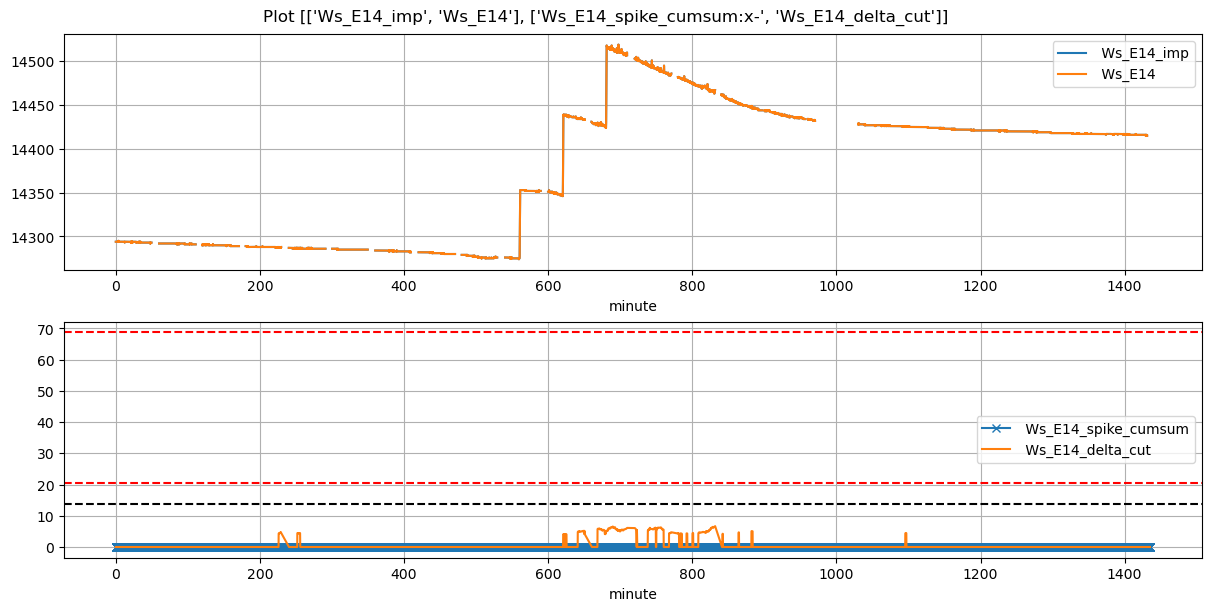
Ws_E14 |
0.227656 |
30 |
560.0 |
560.333333 |
560.62 |
561.166667 |
14275.000000 |
14353.000000 |
37 |
-0.004806 |
-0.009547 |
-0.002593 |
0.344286 |
0.421622 |
15.600000 |
True |
20.0 |
32.8 |
20.683 |
0.0 |
0 |
0.0 |
45 |
387 |
-0.006928 |
NaN |
NaN |
NaN |
| 2025-12-02 10:20:00+08:00 |
57 |
620 |
Ws_E14 |
0.227656 |
30 |
620.0 |
620.333333 |
620.62 |
621.916667 |
14347.207143 |
14439.000000 |
37 |
-0.020589 |
-0.016358 |
-0.012438 |
0.347371 |
0.496178 |
18.358571 |
True |
20.0 |
77.8 |
20.683 |
0.0 |
0 |
0.0 |
20 |
862 |
-0.009712 |
NaN |
NaN |
NaN |
| 2025-12-02 11:20:00+08:00 |
57 |
680 |
Ws_E14 |
0.227656 |
30 |
680.0 |
680.333333 |
680.62 |
681.166667 |
14425.720000 |
14517.333333 |
37 |
-0.014903 |
-0.030459 |
-0.029321 |
0.392857 |
0.495207 |
18.322667 |
True |
20.0 |
32.8 |
20.683 |
0.0 |
0 |
0.0 |
120 |
442 |
-0.031463 |
NaN |
NaN |
NaN |