| 2025-12-01 09:05:00+08:00 |
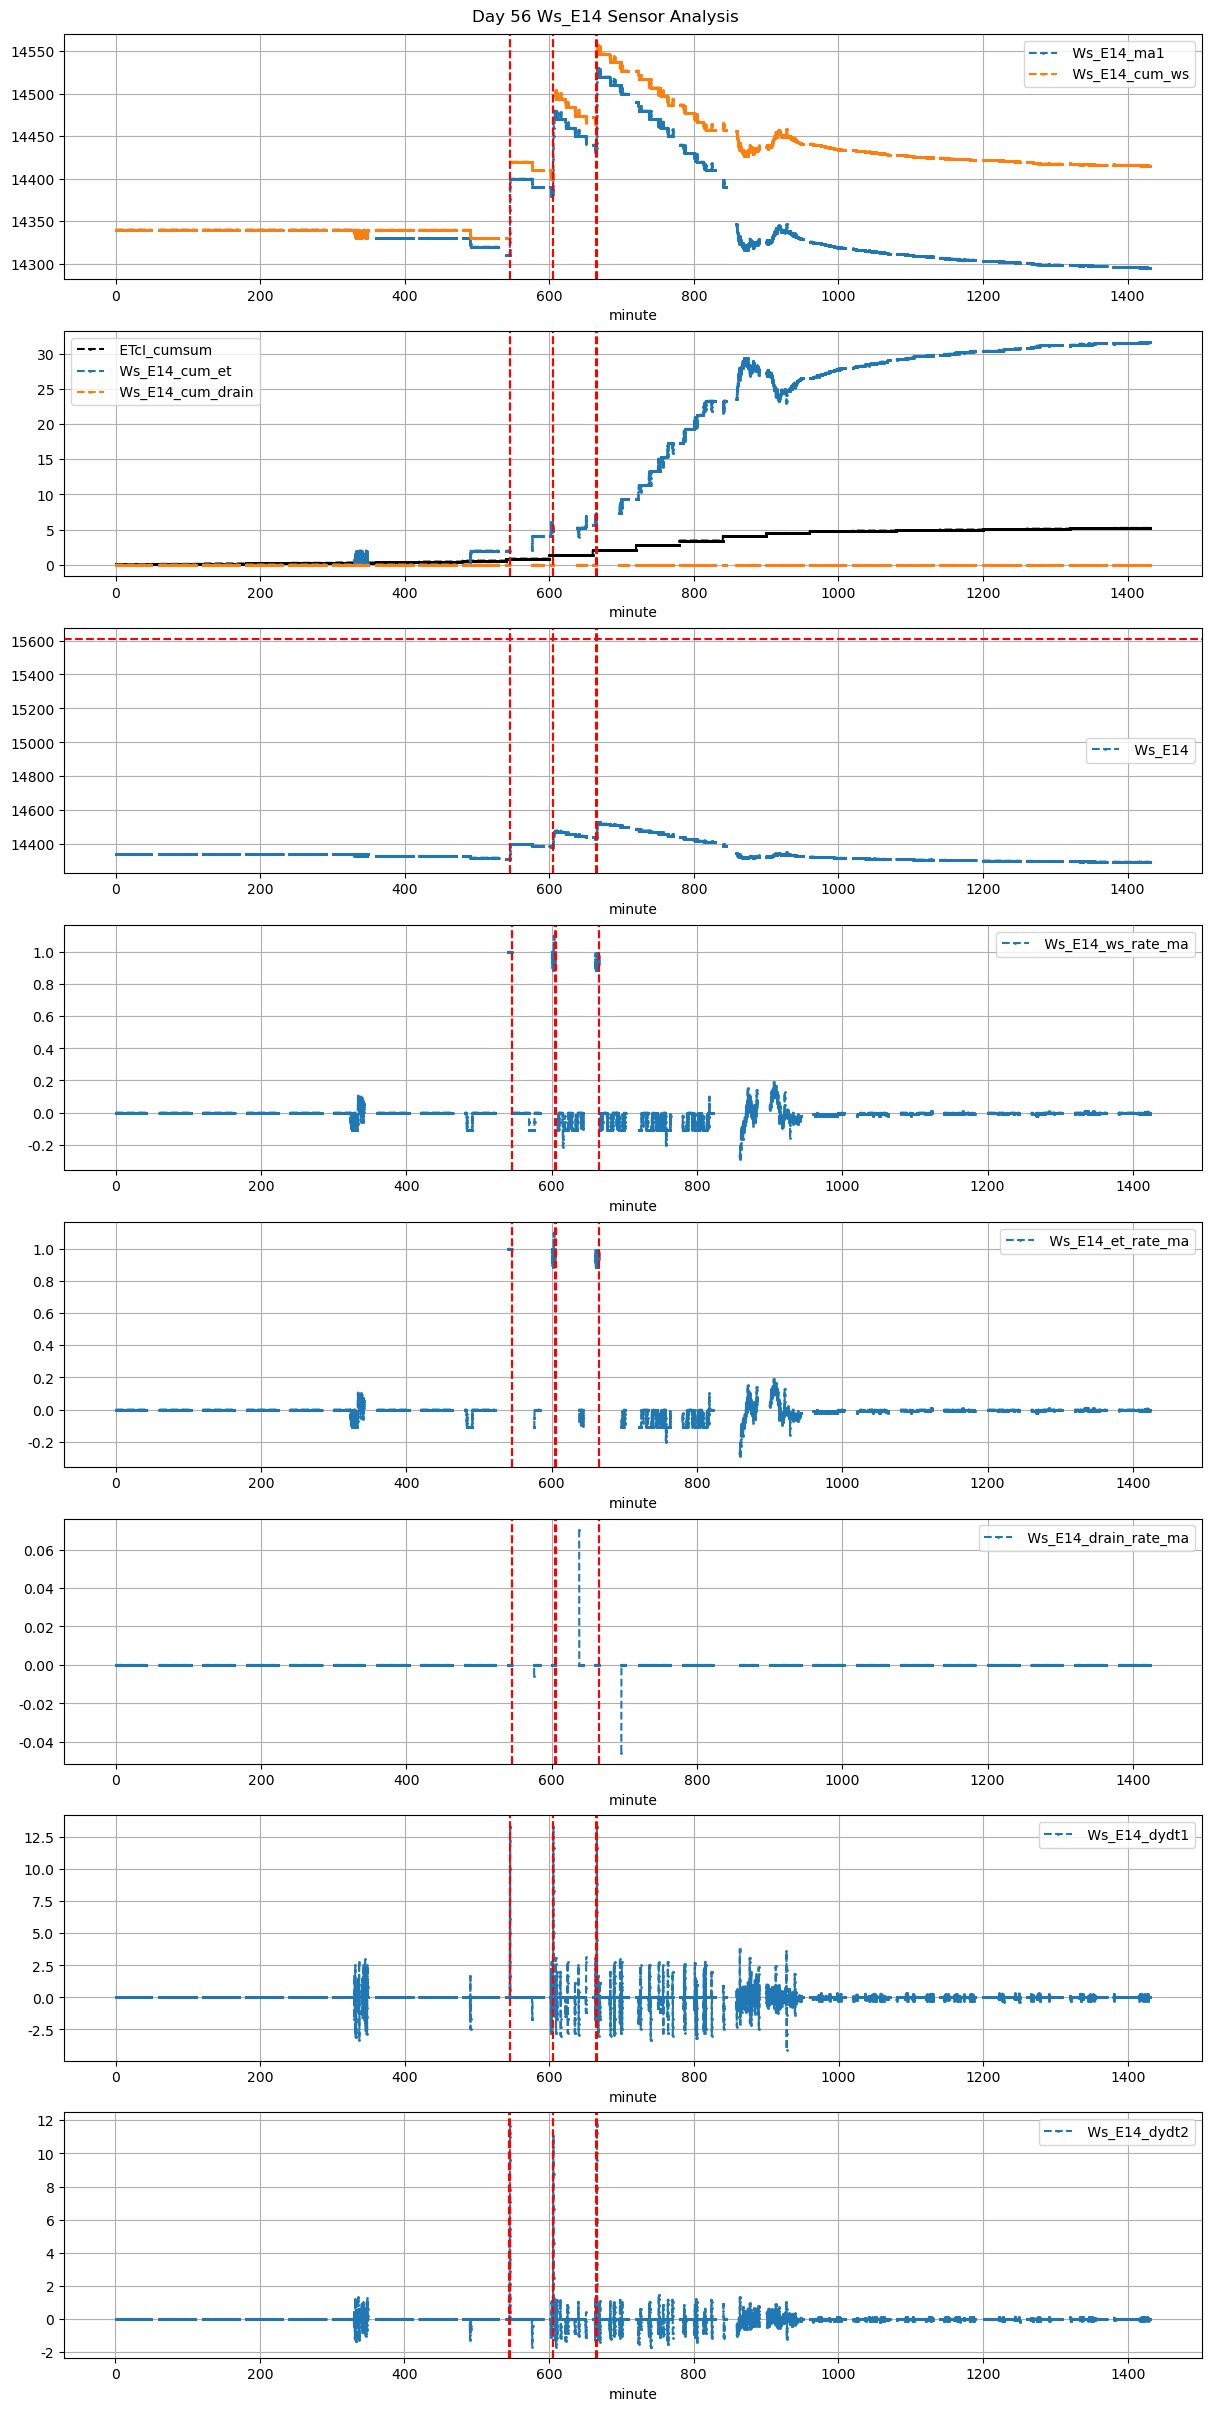
56 |
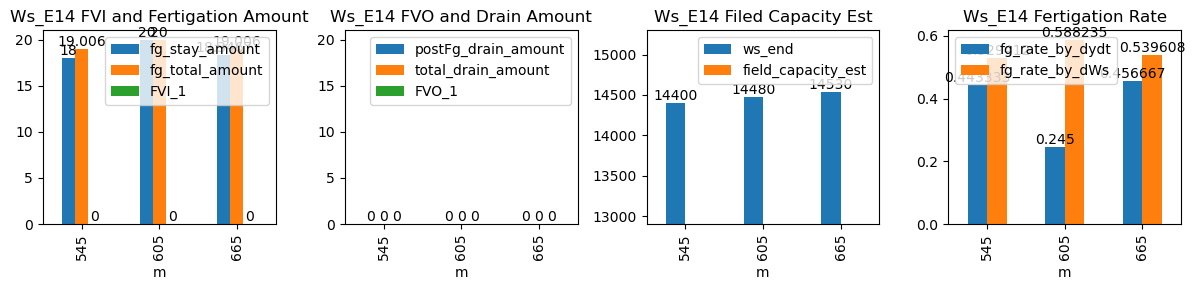
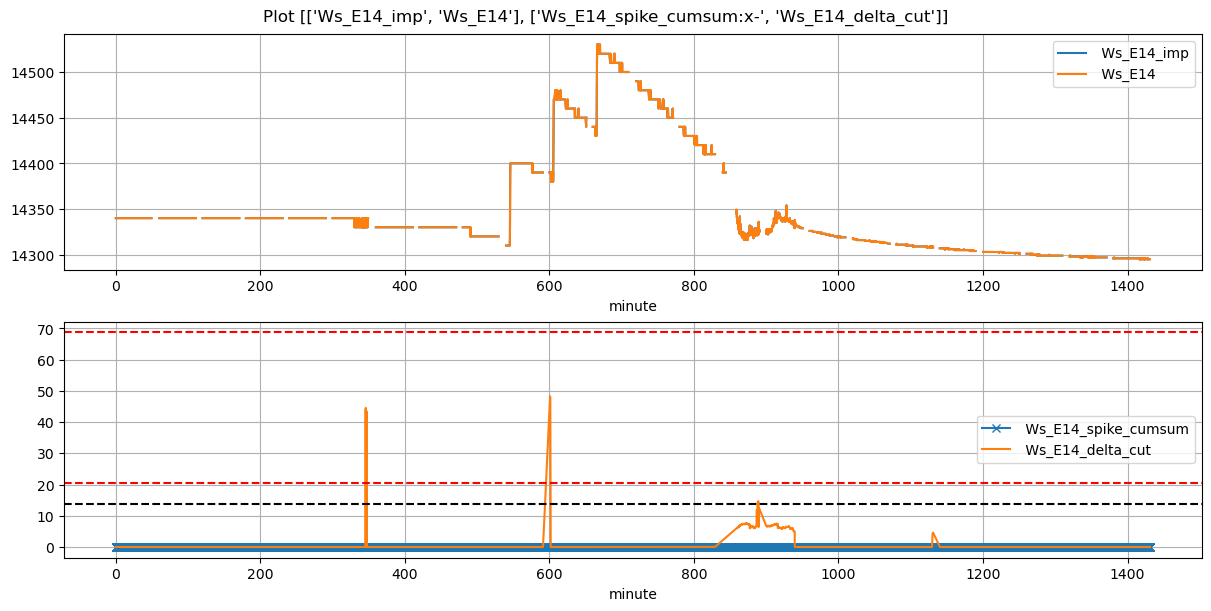
545 |
Ws_E14 |
0.858345 |
30 |
545.0 |
545.416667 |
545.57 |
546.083333 |
14310.000000 |
14400.0 |
34 |
NaN |
0.000000 |
-0.105556 |
0.443333 |
0.529412 |
18.000000 |
True |
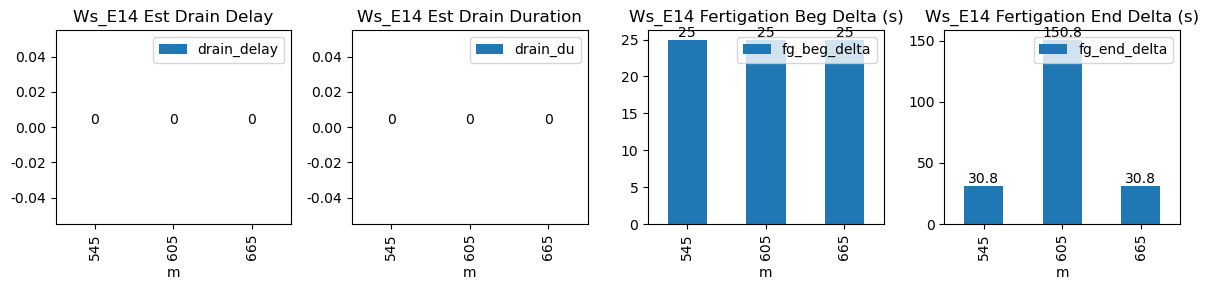
25.0 |
30.8 |
19.006 |
0.0 |
0 |
0.0 |
NaN |
NaN |
NaN |
NaN |
NaN |
NaN |
| 2025-12-01 10:05:00+08:00 |
56 |
605 |
Ws_E14 |
0.858345 |
30 |
605.0 |
605.416667 |
605.57 |
608.083333 |
14380.000000 |
14480.0 |
34 |
NaN |
-0.028642 |
-0.070370 |
0.245000 |
0.588235 |
20.000000 |
True |
25.0 |
150.8 |
20.000 |
0.0 |
0 |
0.0 |
NaN |
NaN |
NaN |
NaN |
NaN |
NaN |
| 2025-12-01 11:05:00+08:00 |
56 |
665 |
Ws_E14 |
0.858345 |
30 |
665.0 |
665.416667 |
665.57 |
666.083333 |
14438.266667 |
14530.0 |
34 |
NaN |
-0.030247 |
-0.065432 |
0.456667 |
0.539608 |
18.346667 |
True |
25.0 |
30.8 |
19.006 |
0.0 |
0 |
0.0 |
NaN |
NaN |
NaN |
NaN |
NaN |
NaN |