| 2025-12-11 09:45:00+08:00 |
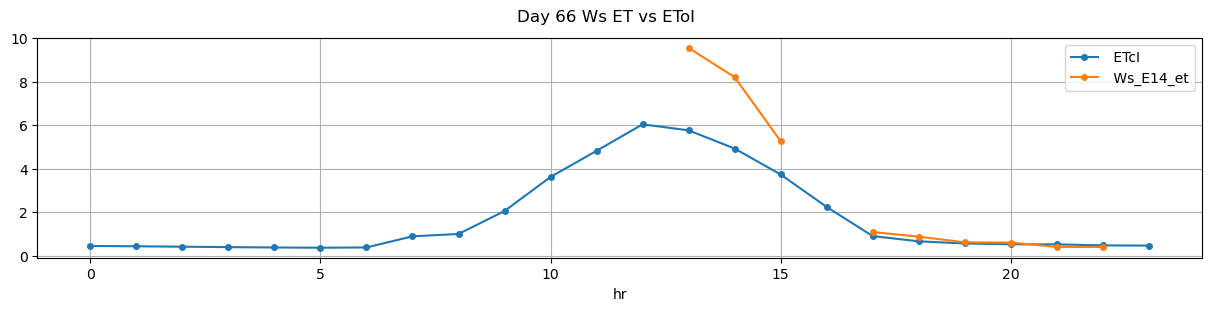
66 |
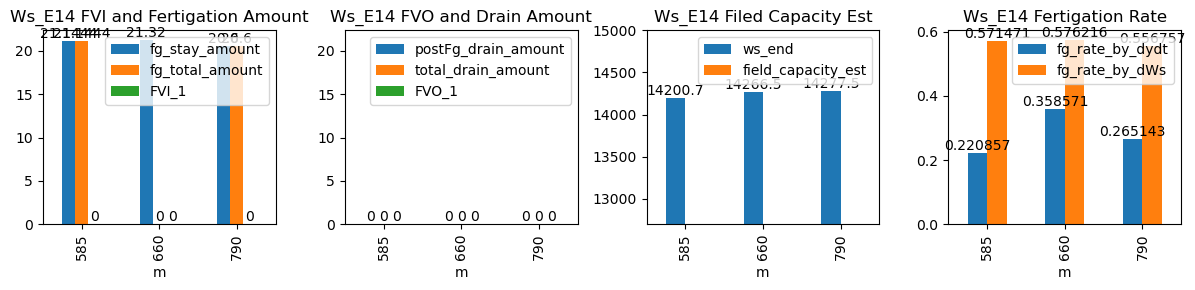
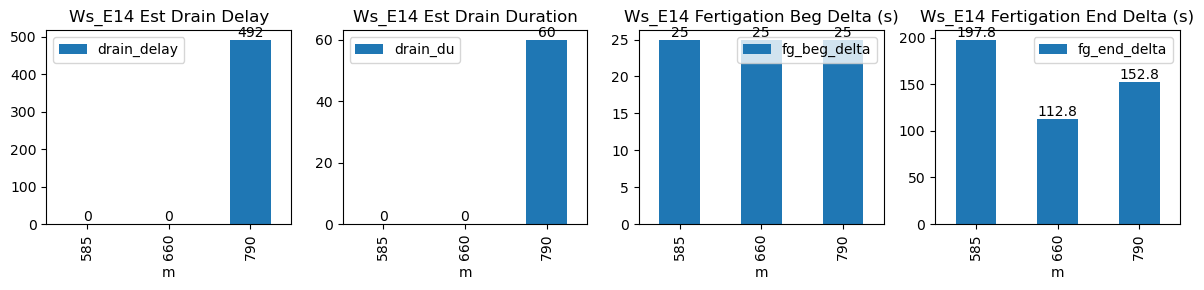
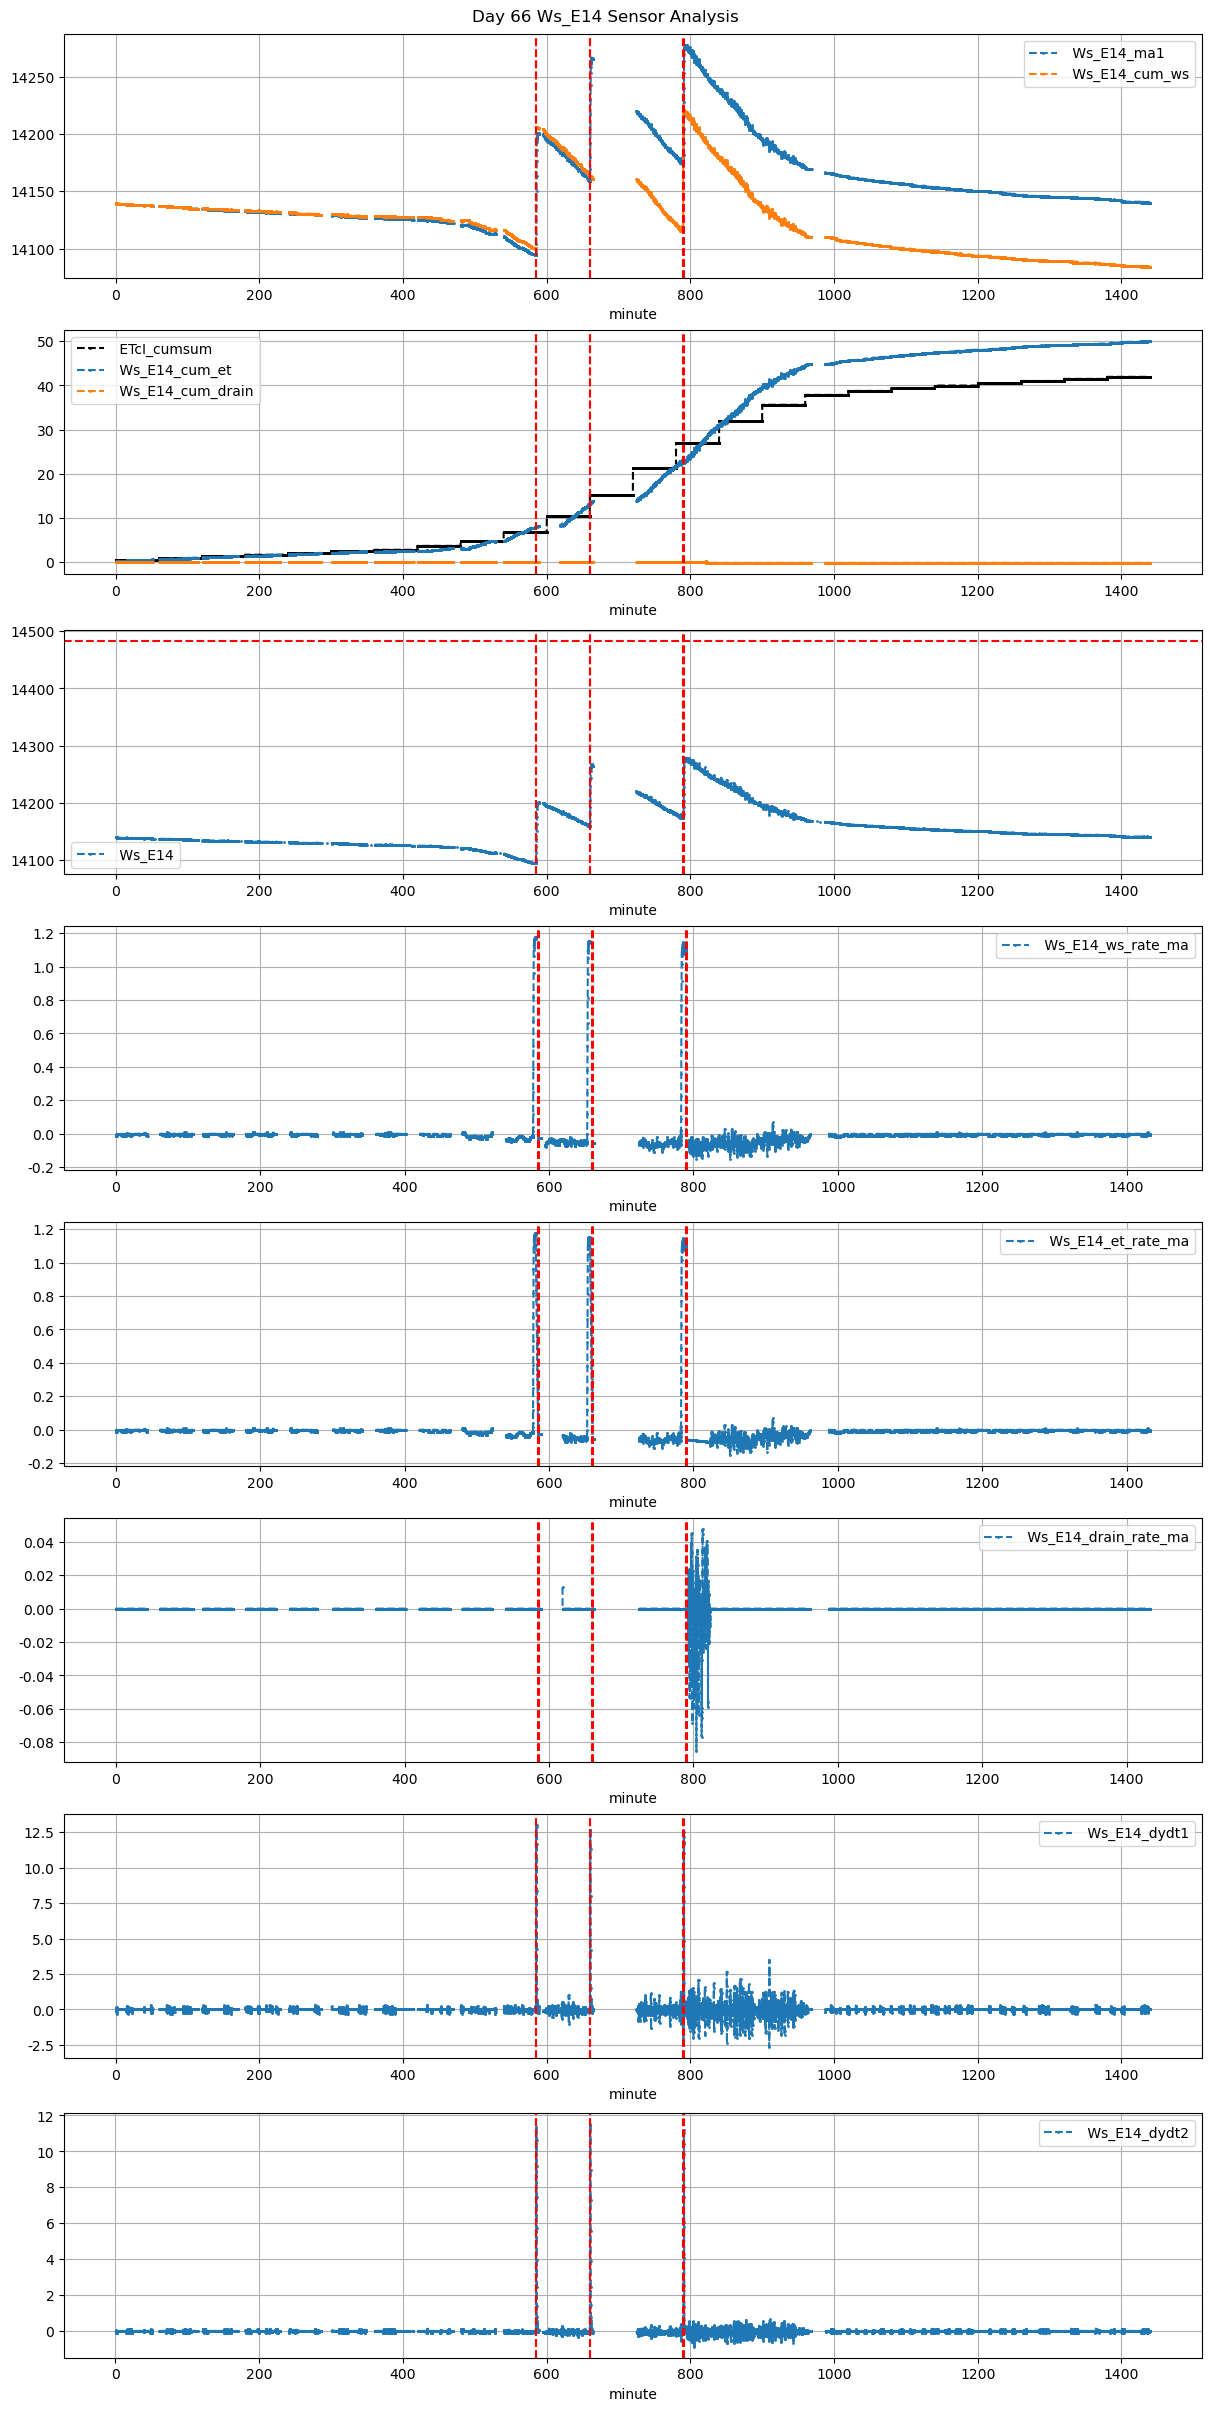
585 |
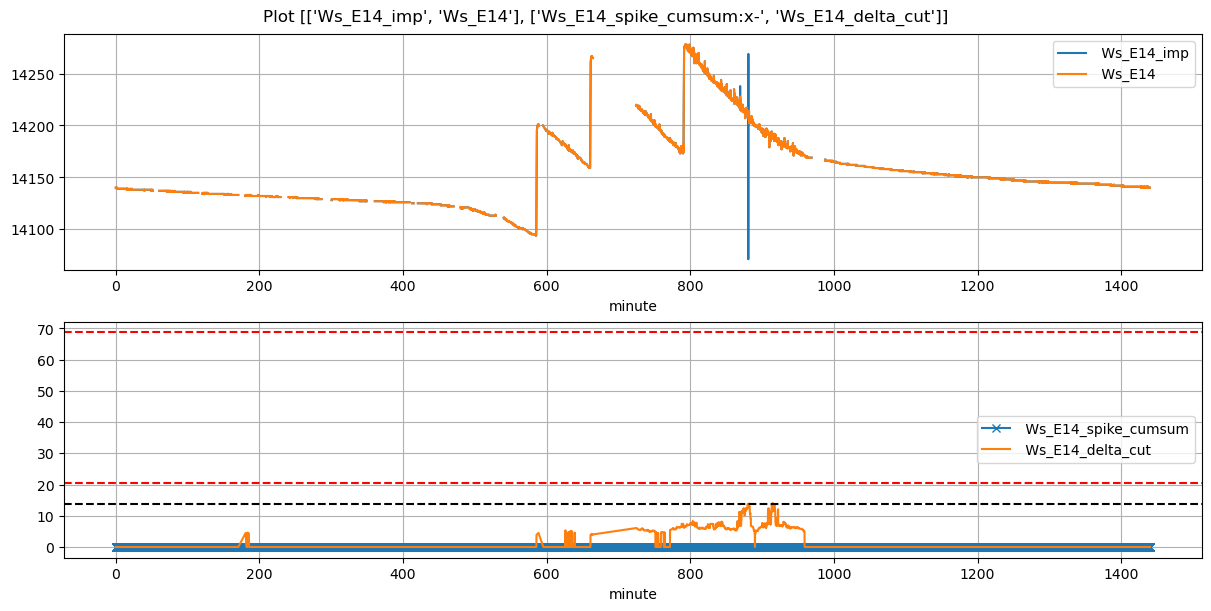
Ws_E14 |
0.360727 |
30 |
585.0 |
585.416667 |
585.62 |
588.916667 |
14095.0 |
14200.722222 |
37 |
-0.027622 |
-0.064224 |
-0.045687 |
0.220857 |
0.571471 |
21.144444 |
True |
25.0 |
197.8 |
21.144444 |
0.0 |
0.0 |
0.0 |
NaN |
NaN |
NaN |
NaN |
NaN |
NaN |
| 2025-12-11 11:00:00+08:00 |
66 |
660 |
Ws_E14 |
0.360727 |
30 |
660.0 |
660.416667 |
660.62 |
662.500000 |
14159.9 |
14266.500000 |
37 |
-0.052871 |
NaN |
-0.052871 |
0.358571 |
0.576216 |
21.320000 |
False |
25.0 |
112.8 |
NaN |
0.0 |
0.0 |
0.0 |
NaN |
NaN |
NaN |
NaN |
NaN |
NaN |
| 2025-12-11 13:10:00+08:00 |
66 |
790 |
Ws_E14 |
0.360727 |
30 |
790.0 |
790.416667 |
790.62 |
793.166667 |
14174.5 |
14277.500000 |
37 |
-0.059655 |
-0.072593 |
-0.072963 |
0.265143 |
0.556757 |
20.600000 |
True |
25.0 |
152.8 |
20.600000 |
0.0 |
0.0 |
0.0 |
60.0 |
492.0 |
-0.055889 |
NaN |
NaN |
NaN |