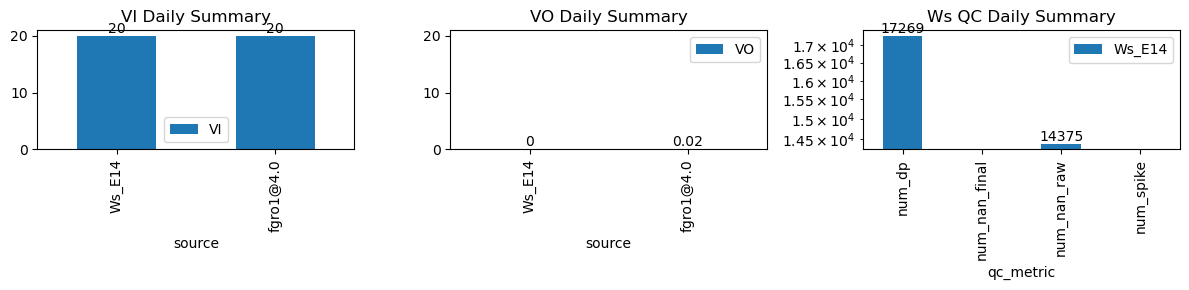
VI and VO Daily Summary
| ws_name | num_dp | num_nan_raw | num_nan_final | num_spike | cum_step_adj |
|---|---|---|---|---|---|
| Ws_E14 | 17,269 | 14,375 | 0 | 0 | 0.00 |
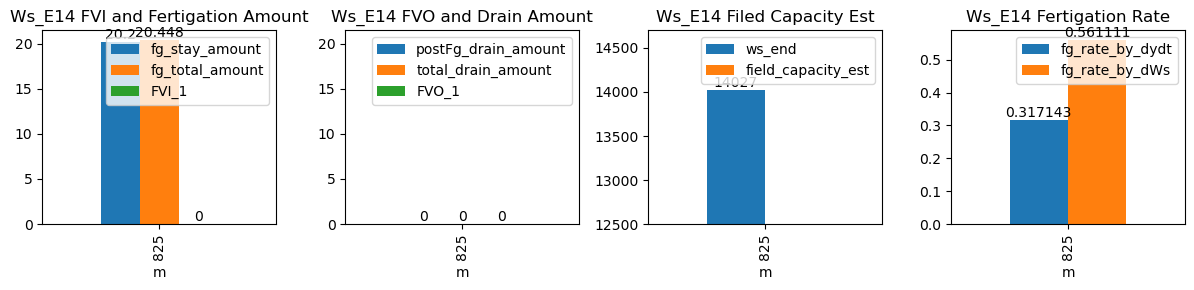
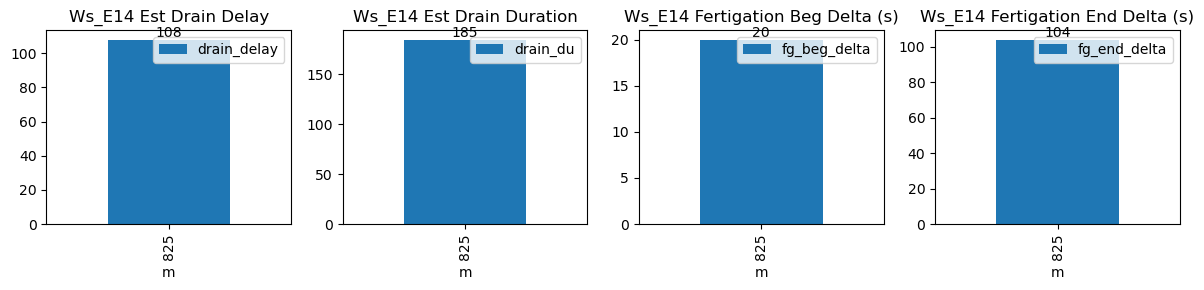
| ds | d | m | ws_name | prominence_cut | max_drain_du | fg_beg | fg_beg_est | fg_end | fg_end_est | ws_beg | ws_end | duc | pre_fg_et | post_fg_ws | post_drn_et | fg_rate_by_dydt | fg_rate_by_dWs | fg_stay_amount | enough_data | fg_beg_delta | fg_end_delta | fg_total_amount | fg_drain_amount | postFg_drain_amount | total_drain_amount | drain_du | drain_delay | drain_rate | field_capacity_est | FVI_1 | FVO_1 |
|---|---|---|---|---|---|---|---|---|---|---|---|---|---|---|---|---|---|---|---|---|---|---|---|---|---|---|---|---|---|---|---|
| 2025-12-24 13:45:00+08:00 | 79 | 825 | Ws_E14 | 0.144333 | 30 | 825.0 | 825.333333 | 825.6 | 827.333333 | 13926.0 | 14027.0 | 36 | 0.0 | -0.006235 | -0.004506 | 0.317143 | 0.561111 | 20.2 | True | 20.0 | 104.0 | 20.448 | 0.0 | 0 | 0.0 | 185 | 108 | -0.022129 | NaN | NaN | NaN |