| 2026-01-02 09:05:00+08:00 |
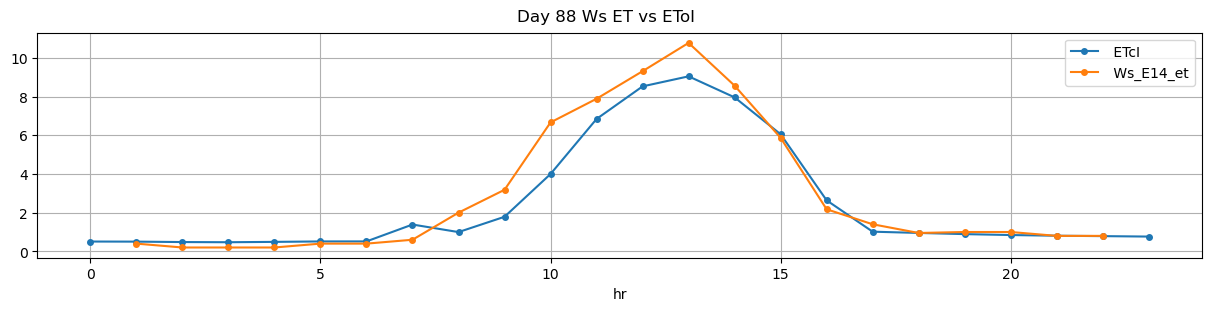
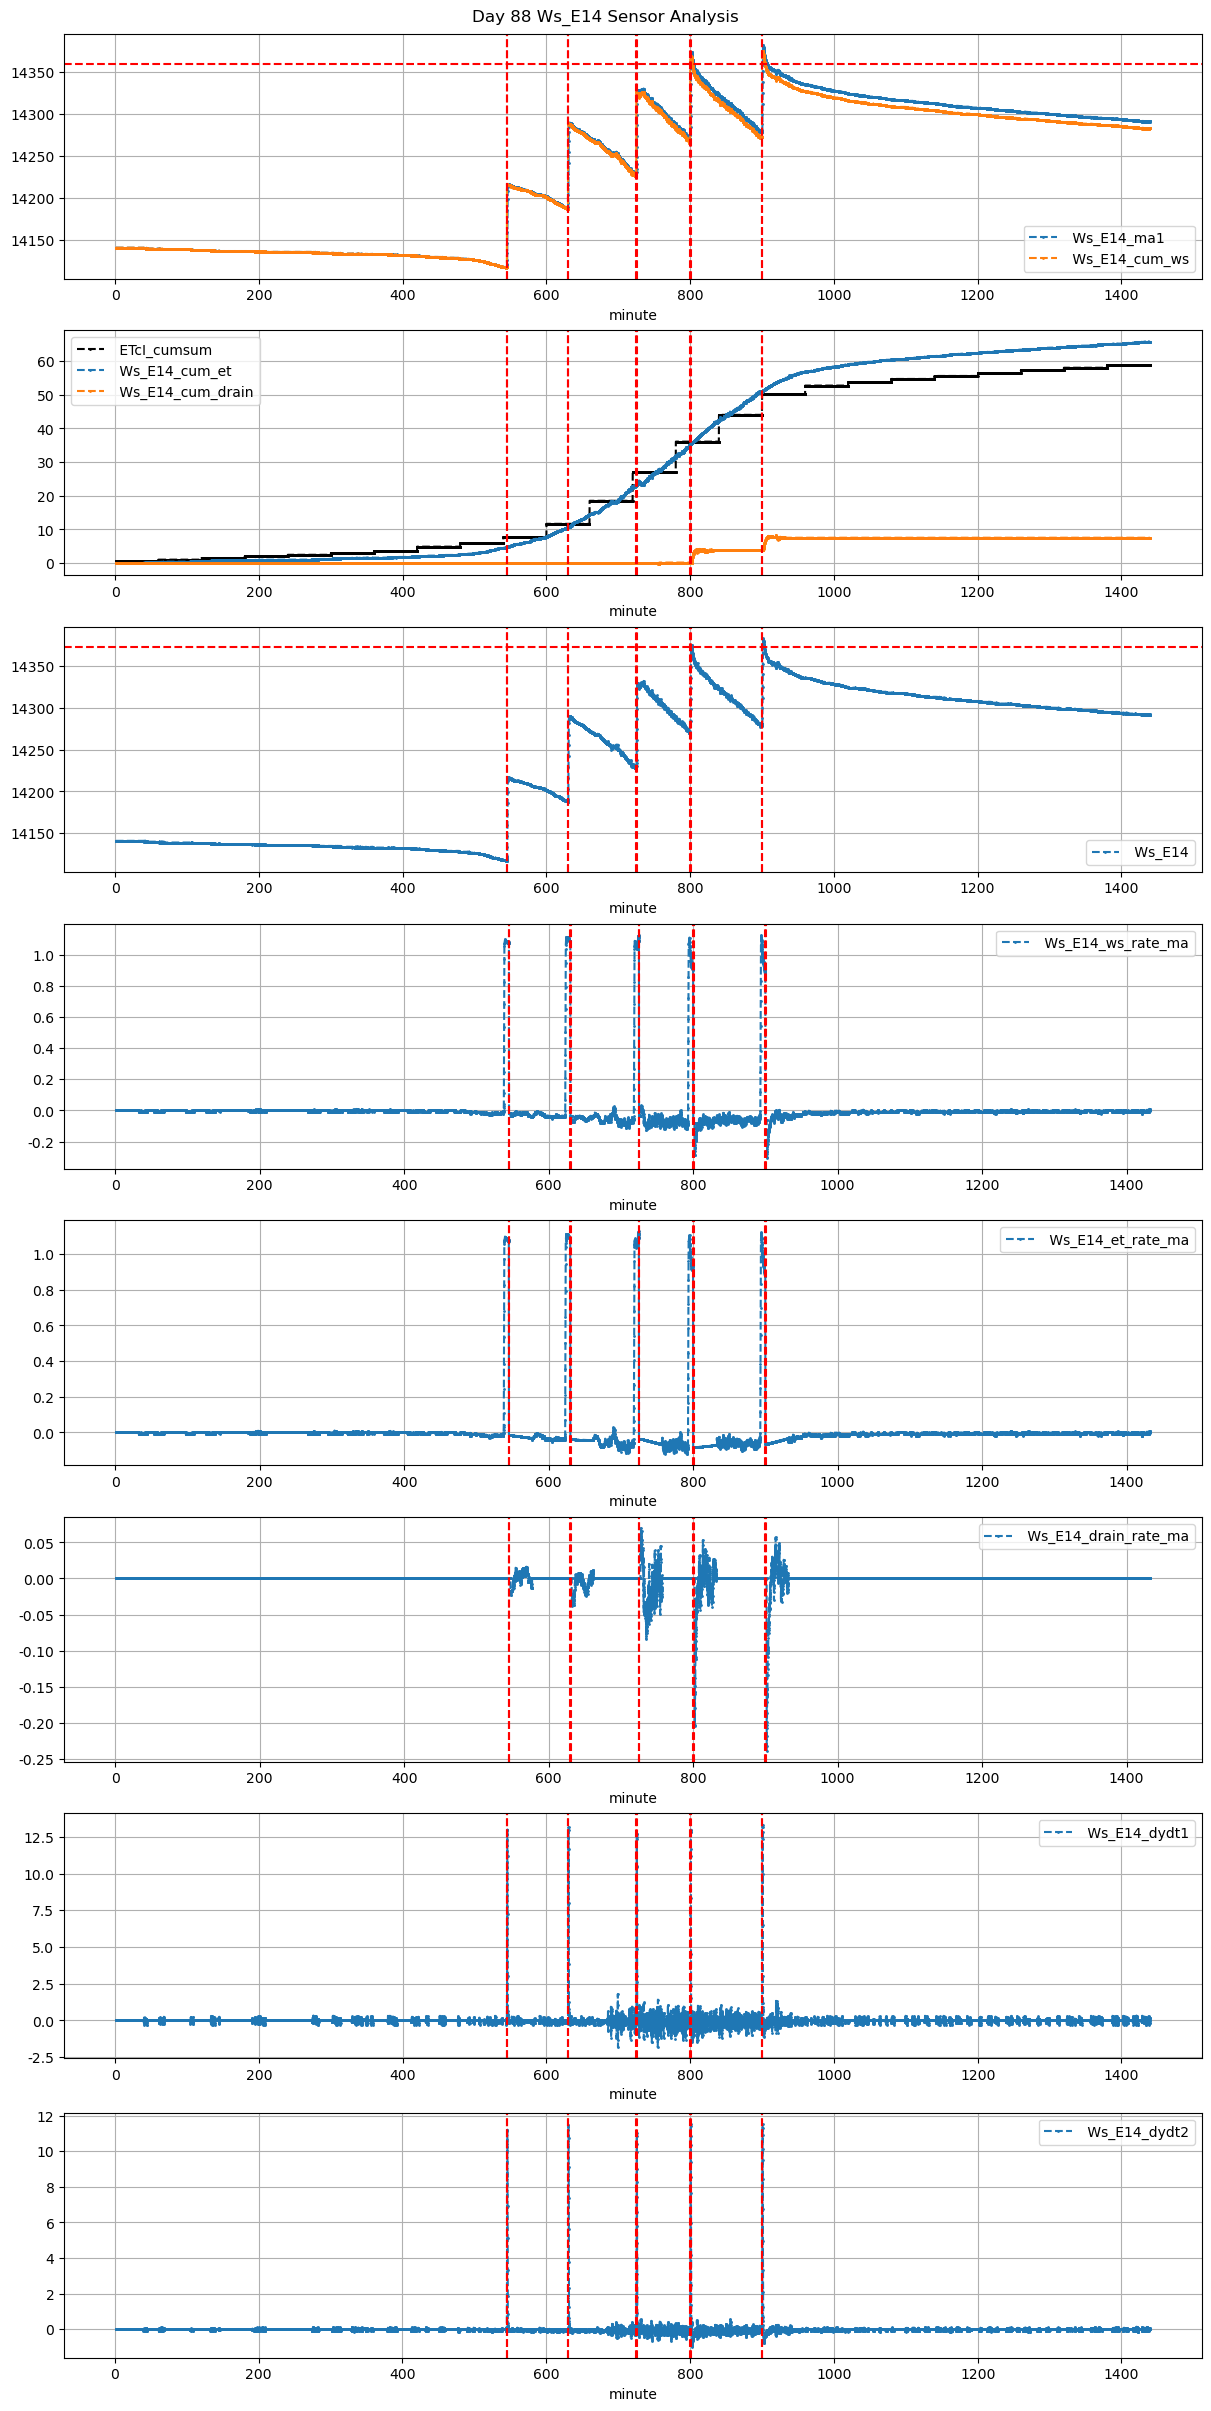
88 |
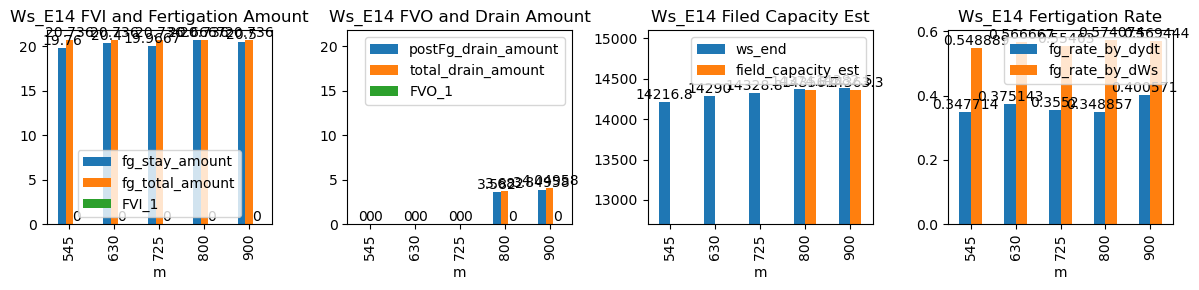
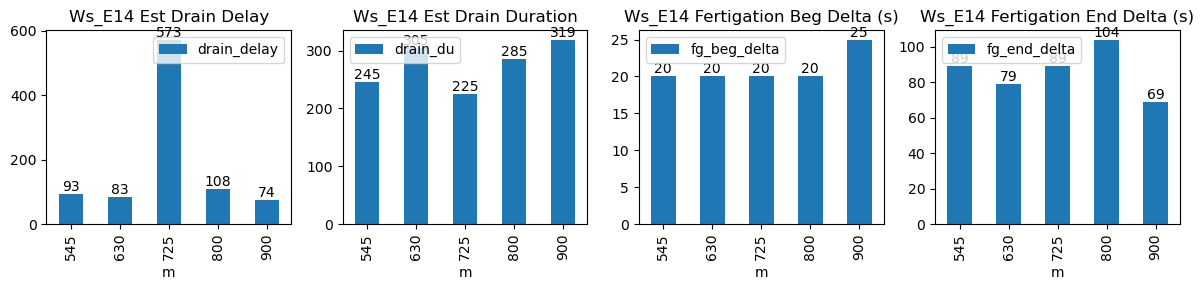
545 |
Ws_E14 |
0.359155 |
30 |
545.0 |
545.333333 |
545.6 |
547.166667 |
14117.955556 |
14217.0 |
36 |
-0.009746 |
-0.033965 |
-0.033939 |
0.346857 |
0.550247 |
19.808889 |
True |
20.0 |
94.0 |
20.736 |
0.0 |
0.000000 |
0.000000 |
15 |
543 |
-0.221001 |
NaN |
NaN |
NaN |
| 2026-01-02 10:30:00+08:00 |
88 |
630 |
Ws_E14 |
0.359155 |
30 |
630.0 |
630.333333 |
630.6 |
631.833333 |
14188.000000 |
14290.0 |
36 |
-0.033898 |
-0.071667 |
-0.042083 |
0.385286 |
0.566667 |
20.400000 |
True |
20.0 |
74.0 |
20.736 |
0.0 |
0.000000 |
0.000000 |
19 |
134 |
-0.215591 |
NaN |
NaN |
NaN |
| 2026-01-02 12:05:00+08:00 |
88 |
725 |
Ws_E14 |
0.359155 |
30 |
725.0 |
725.333333 |
725.6 |
727.083333 |
14228.457143 |
14329.0 |
36 |
-0.058282 |
0.000000 |
-0.068333 |
0.355200 |
0.558571 |
20.108571 |
True |
20.0 |
89.0 |
20.736 |
0.0 |
0.000000 |
0.000000 |
10 |
198 |
-1.012354 |
NaN |
NaN |
NaN |
| 2026-01-02 13:20:00+08:00 |
88 |
800 |
Ws_E14 |
0.359155 |
30 |
800.0 |
800.333333 |
800.6 |
802.416667 |
14270.000000 |
14375.0 |
36 |
-0.087147 |
-0.171713 |
-0.074653 |
0.342143 |
0.583333 |
21.000000 |
True |
20.0 |
109.0 |
21.000 |
0.0 |
0.000000 |
0.000000 |
54 |
113 |
-1.002020 |
NaN |
NaN |
NaN |
| 2026-01-02 15:00:00+08:00 |
88 |
900 |
Ws_E14 |
0.359155 |
30 |
900.0 |
900.416667 |
900.6 |
901.833333 |
14279.746667 |
14383.0 |
36 |
-0.053967 |
-0.195764 |
-0.027407 |
0.395429 |
0.573630 |
20.650667 |
True |
25.0 |
74.0 |
20.736 |
0.1 |
4.276084 |
4.376084 |
145 |
78 |
-0.626727 |
14361.619581 |
NaN |
NaN |