| 2026-01-03 10:35:00+08:00 |
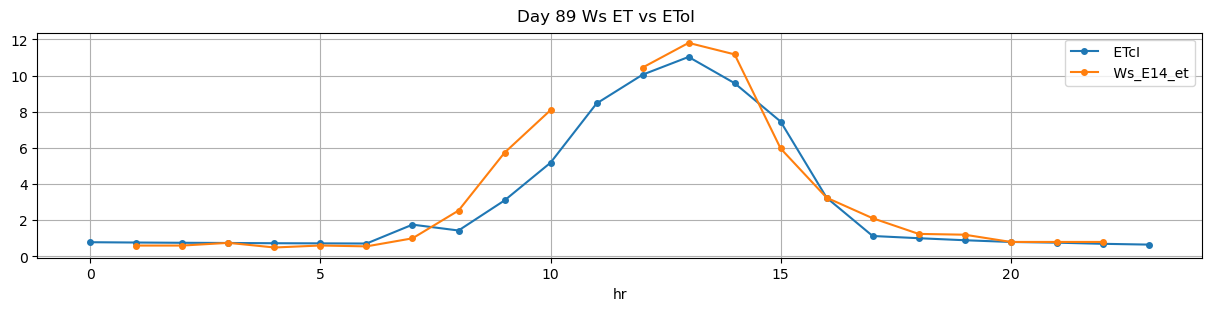
89 |
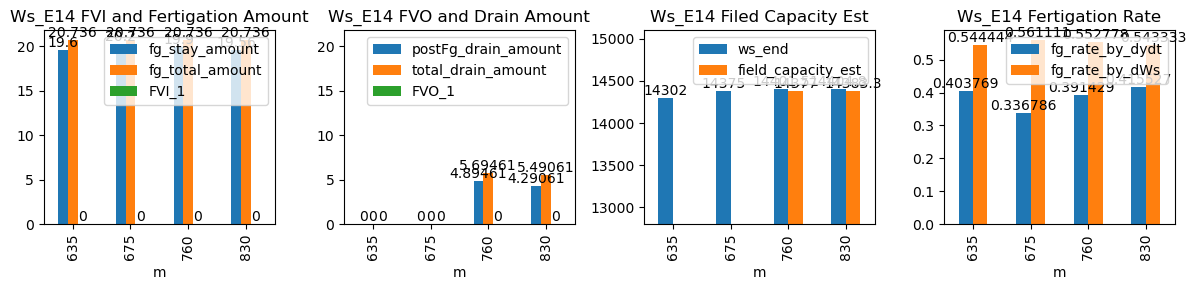
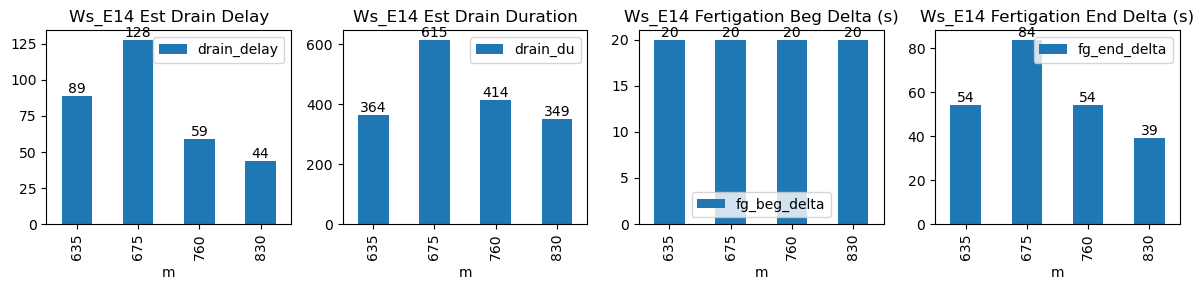
635 |
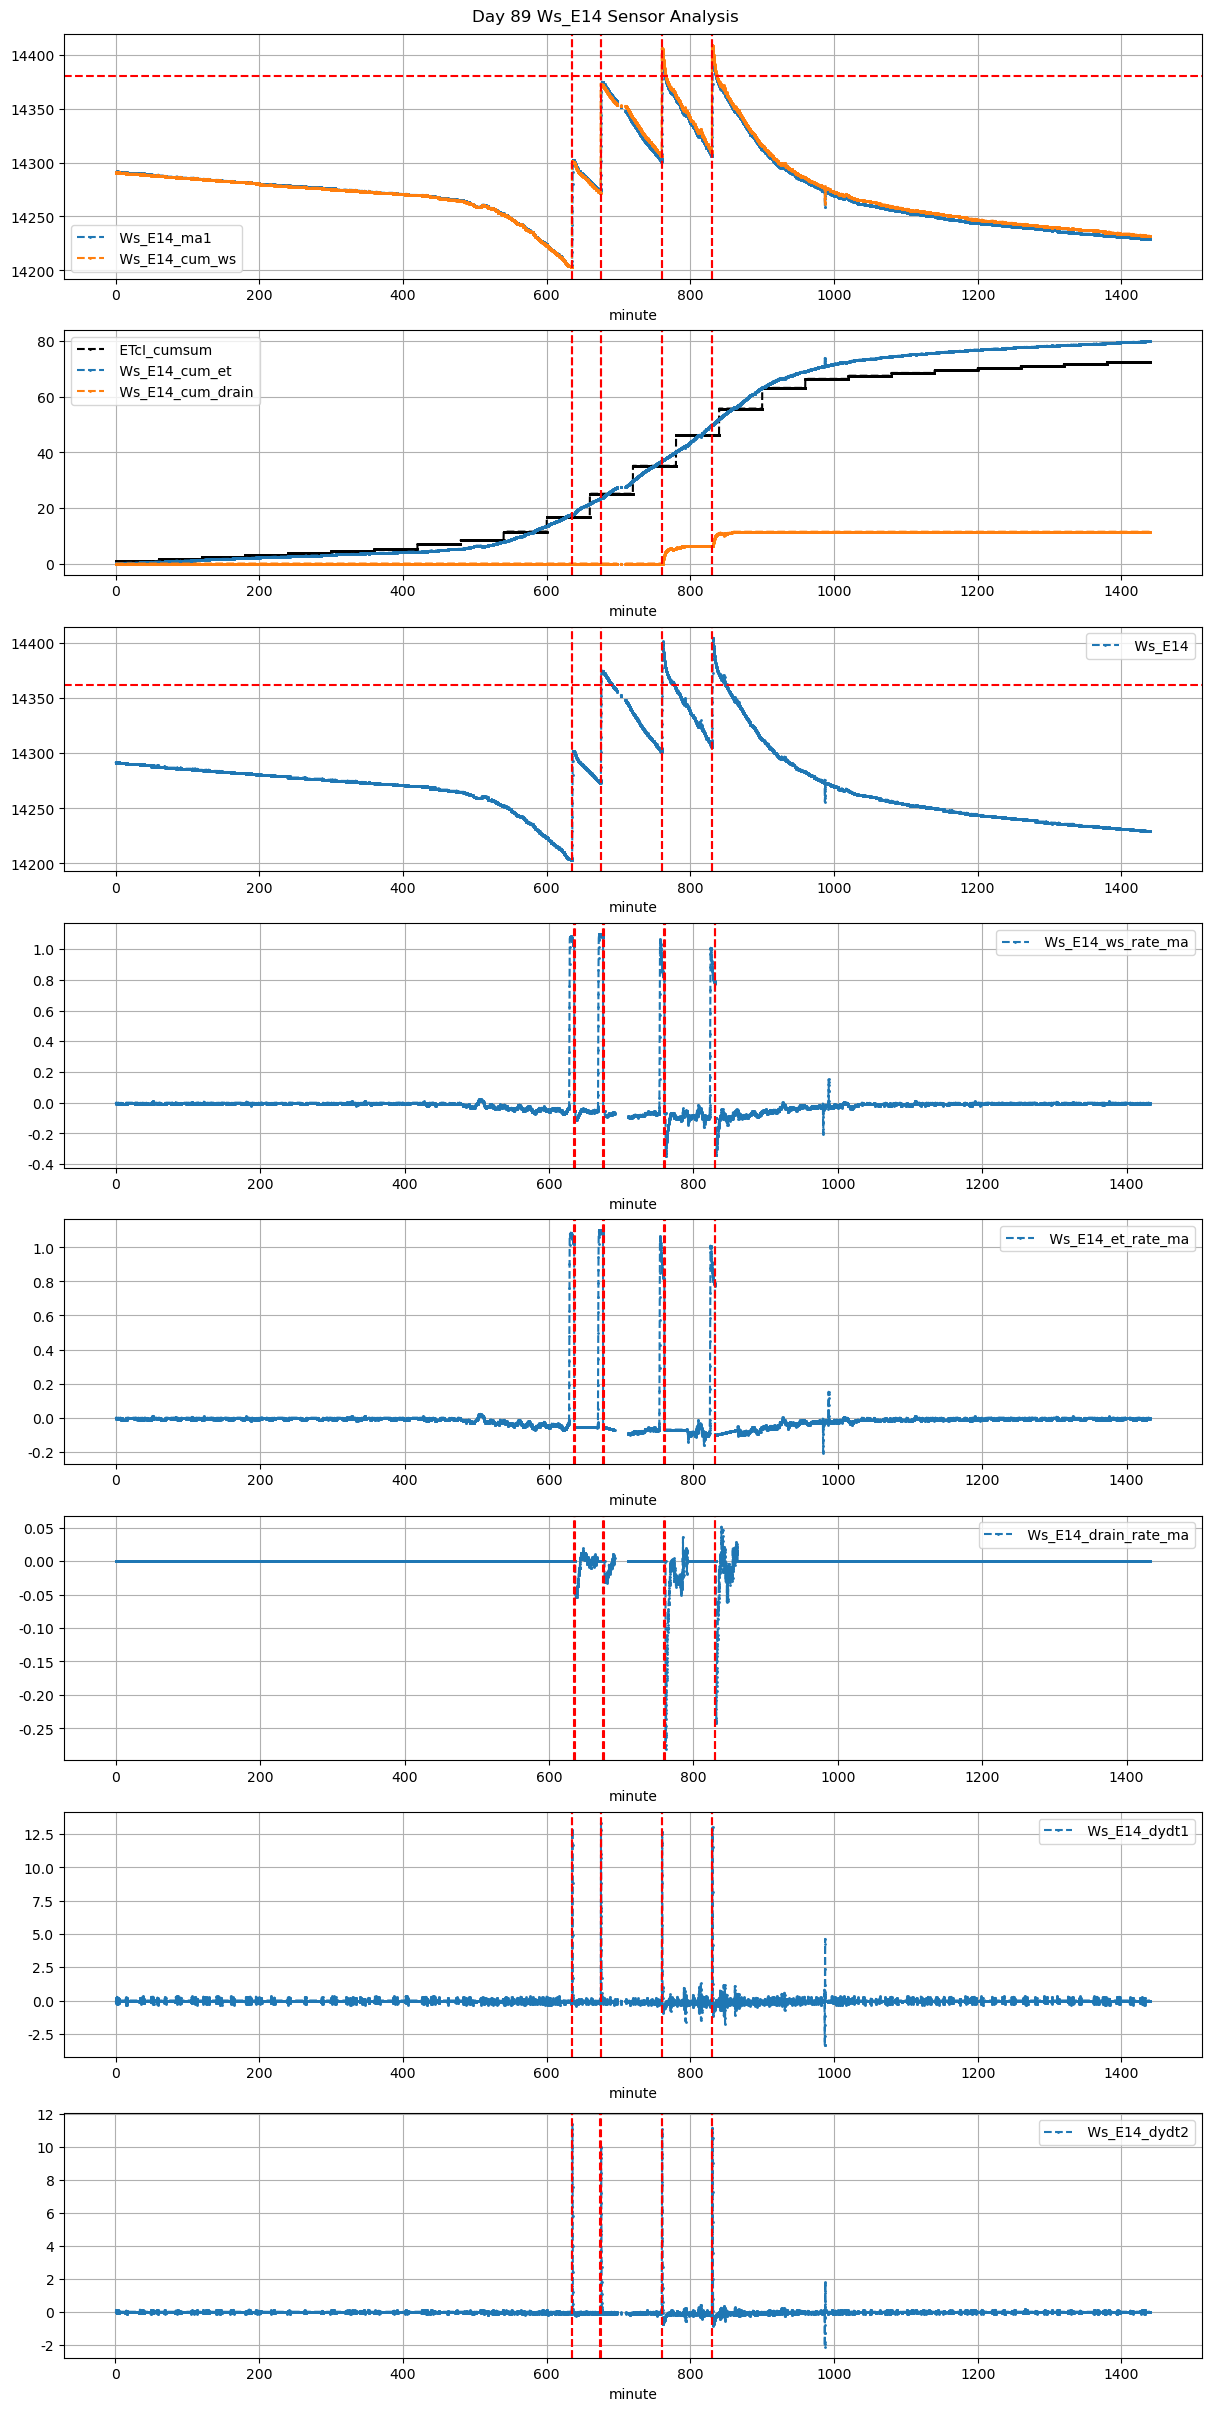
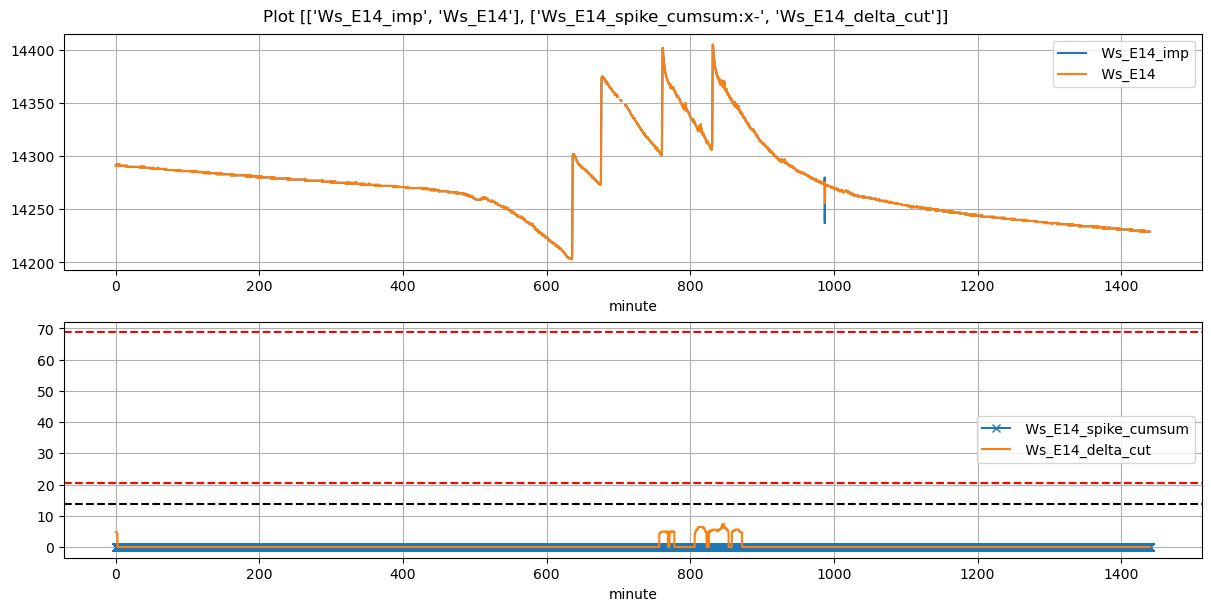
Ws_E14 |
0.352295 |
30 |
635.0 |
635.333333 |
635.6 |
636.50 |
14204.0 |
14302.0 |
36 |
-0.056750 |
-0.086221 |
-0.056190 |
0.403769 |
0.544444 |
19.60 |
True |
20.0 |
54.0 |
20.736 |
0.0 |
0.000000 |
0.000000 |
364 |
89 |
-0.053281 |
NaN |
NaN |
NaN |
| 2026-01-03 11:15:00+08:00 |
89 |
675 |
Ws_E14 |
0.352295 |
30 |
675.0 |
675.333333 |
675.6 |
677.00 |
14274.0 |
14375.0 |
36 |
-0.055870 |
-0.080741 |
-0.072310 |
0.336786 |
0.561111 |
20.20 |
True |
20.0 |
84.0 |
20.736 |
0.0 |
0.000000 |
0.000000 |
615 |
128 |
-0.029333 |
NaN |
NaN |
NaN |
| 2026-01-03 12:40:00+08:00 |
89 |
760 |
Ws_E14 |
0.352295 |
30 |
760.0 |
760.333333 |
760.6 |
761.50 |
14302.0 |
14401.5 |
36 |
-0.069725 |
-0.170321 |
-0.070062 |
0.391429 |
0.552778 |
19.90 |
True |
20.0 |
54.0 |
20.736 |
0.8 |
4.894612 |
5.694612 |
414 |
59 |
-0.189427 |
14377.026941 |
NaN |
NaN |
| 2026-01-03 13:50:00+08:00 |
89 |
830 |
Ws_E14 |
0.352295 |
30 |
830.0 |
830.333333 |
830.6 |
831.25 |
14307.0 |
14404.8 |
36 |
-0.100785 |
-0.175514 |
-0.071466 |
0.415527 |
0.543333 |
19.56 |
True |
20.0 |
39.0 |
20.736 |
1.2 |
4.290605 |
5.490605 |
349 |
44 |
-0.183569 |
14383.346974 |
NaN |
NaN |