VI and VO Daily Summary
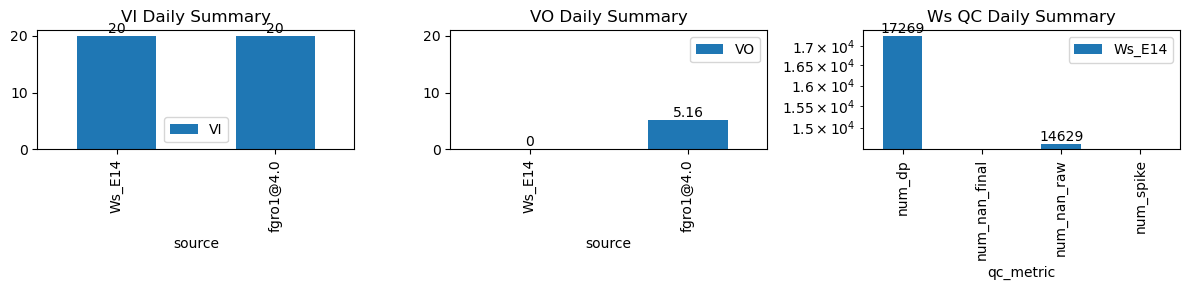
| ws_name | num_dp | num_nan_raw | num_nan_final | num_spike | cum_step_adj |
|---|---|---|---|---|---|
| Ws_E14 | 17,269 | 14,629 | 0 | 0 | 0.00 |
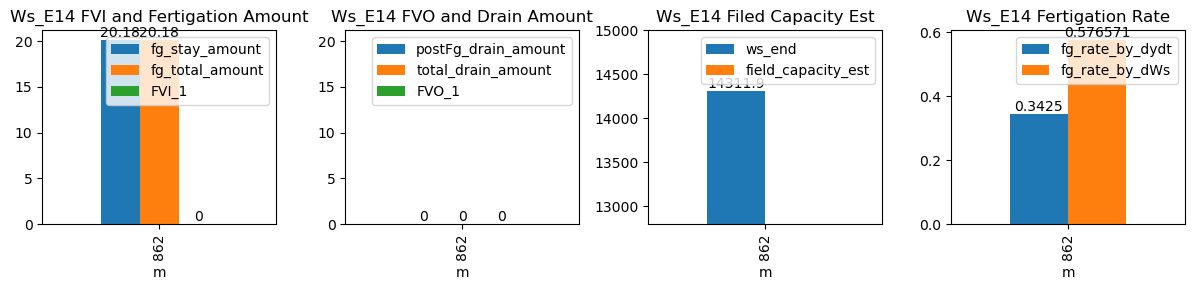
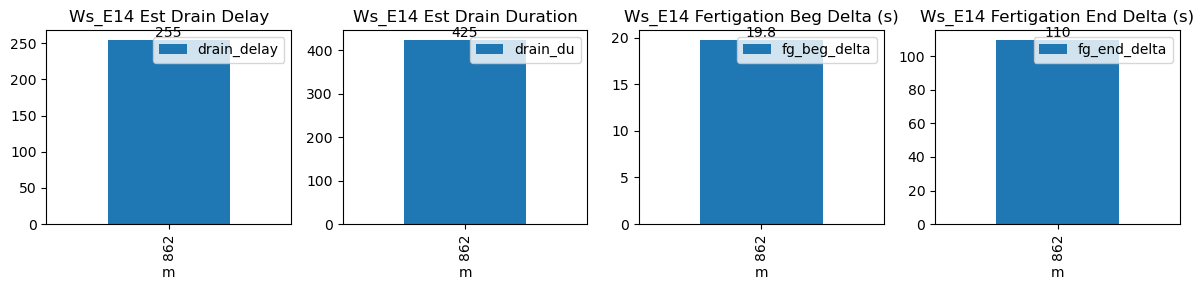
| ds | d | m | ws_name | prominence_cut | max_drain_du | fg_beg | fg_beg_est | fg_end | fg_end_est | ws_beg | ws_end | duc | pre_fg_et | post_fg_ws | post_drn_et | fg_rate_by_dydt | fg_rate_by_dWs | fg_stay_amount | enough_data | fg_beg_delta | fg_end_delta | fg_total_amount | fg_drain_amount | postFg_drain_amount | total_drain_amount | drain_du | drain_delay | drain_rate | field_capacity_est | FVI_1 | FVO_1 |
|---|---|---|---|---|---|---|---|---|---|---|---|---|---|---|---|---|---|---|---|---|---|---|---|---|---|---|---|---|---|---|---|
| 2026-01-04 14:22:10+08:00 | 90 | 862 | Ws_E14 | 0.140277 | 30 | 862.17 | 862.5 | 862.75 | 864.583333 | 14211.0 | 14311.9 | 35 | -0.000185 | -0.016086 | -0.010753 | 0.3425 | 0.576571 | 20.18 | True | 19.8 | 110.0 | 20.18 | 0.0 | 0 | 0.0 | 425 | 255 | -0.020739 | NaN | NaN | NaN |