VI and VO Daily Summary
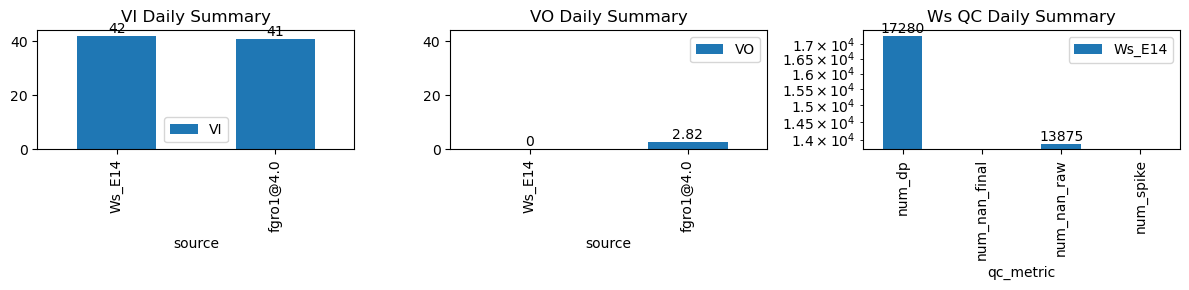
| ws_name | num_dp | num_nan_raw | num_nan_final | num_spike | cum_step_adj |
|---|---|---|---|---|---|
| Ws_E14 | 17,280 | 13,875 | 0 | 0 | 0.00 |
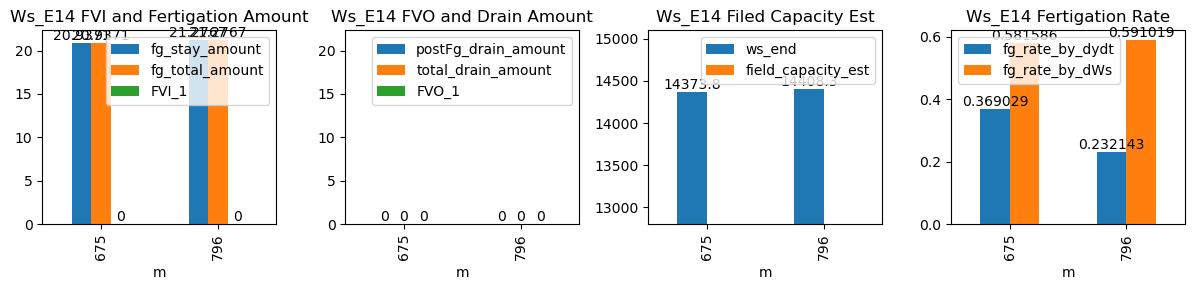
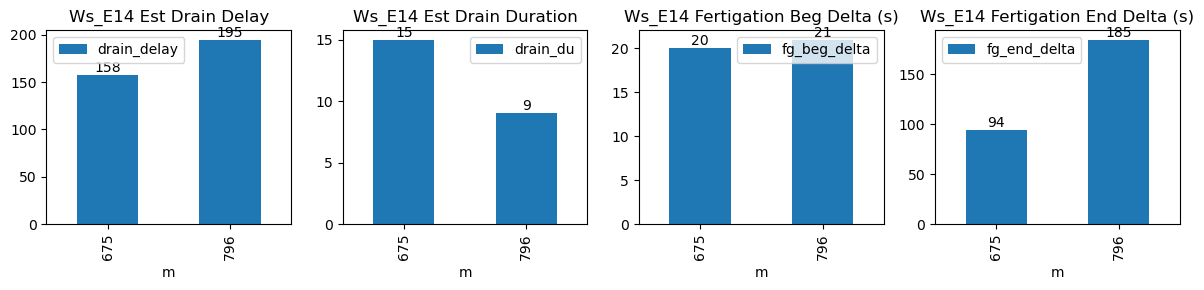
| ds | d | m | ws_name | prominence_cut | max_drain_du | fg_beg | fg_beg_est | fg_end | fg_end_est | ws_beg | ws_end | duc | pre_fg_et | post_fg_ws | post_drn_et | fg_rate_by_dydt | fg_rate_by_dWs | fg_stay_amount | enough_data | fg_beg_delta | fg_end_delta | fg_total_amount | fg_drain_amount | postFg_drain_amount | total_drain_amount | drain_du | drain_delay | drain_rate | field_capacity_est | FVI_1 | FVO_1 |
|---|---|---|---|---|---|---|---|---|---|---|---|---|---|---|---|---|---|---|---|---|---|---|---|---|---|---|---|---|---|---|---|
| 2026-01-05 11:15:00+08:00 | 91 | 675 | Ws_E14 | 0.315695 | 30 | 675.00 | 675.333333 | 675.60 | 677.166667 | 14269.000000 | 14374.0 | 36 | -0.014529 | -0.018565 | -0.024093 | 0.369029 | 0.583333 | 21.000000 | True | 20.0 | 94.0 | 21.000000 | 0.0 | 0 | 0.0 | 15 | 158 | -0.257986 | NaN | NaN | NaN |
| 2026-01-05 13:16:09+08:00 | 91 | 796 | Ws_E14 | 0.315695 | 30 | 796.15 | 796.500000 | 796.75 | 799.833333 | 14301.466667 | 14411.0 | 36 | -0.036962 | -0.044398 | -0.017778 | 0.232143 | 0.608519 | 21.906667 | True | 21.0 | 185.0 | 21.906667 | 0.0 | 0 | 0.0 | 9 | 195 | -1.057932 | NaN | NaN | NaN |