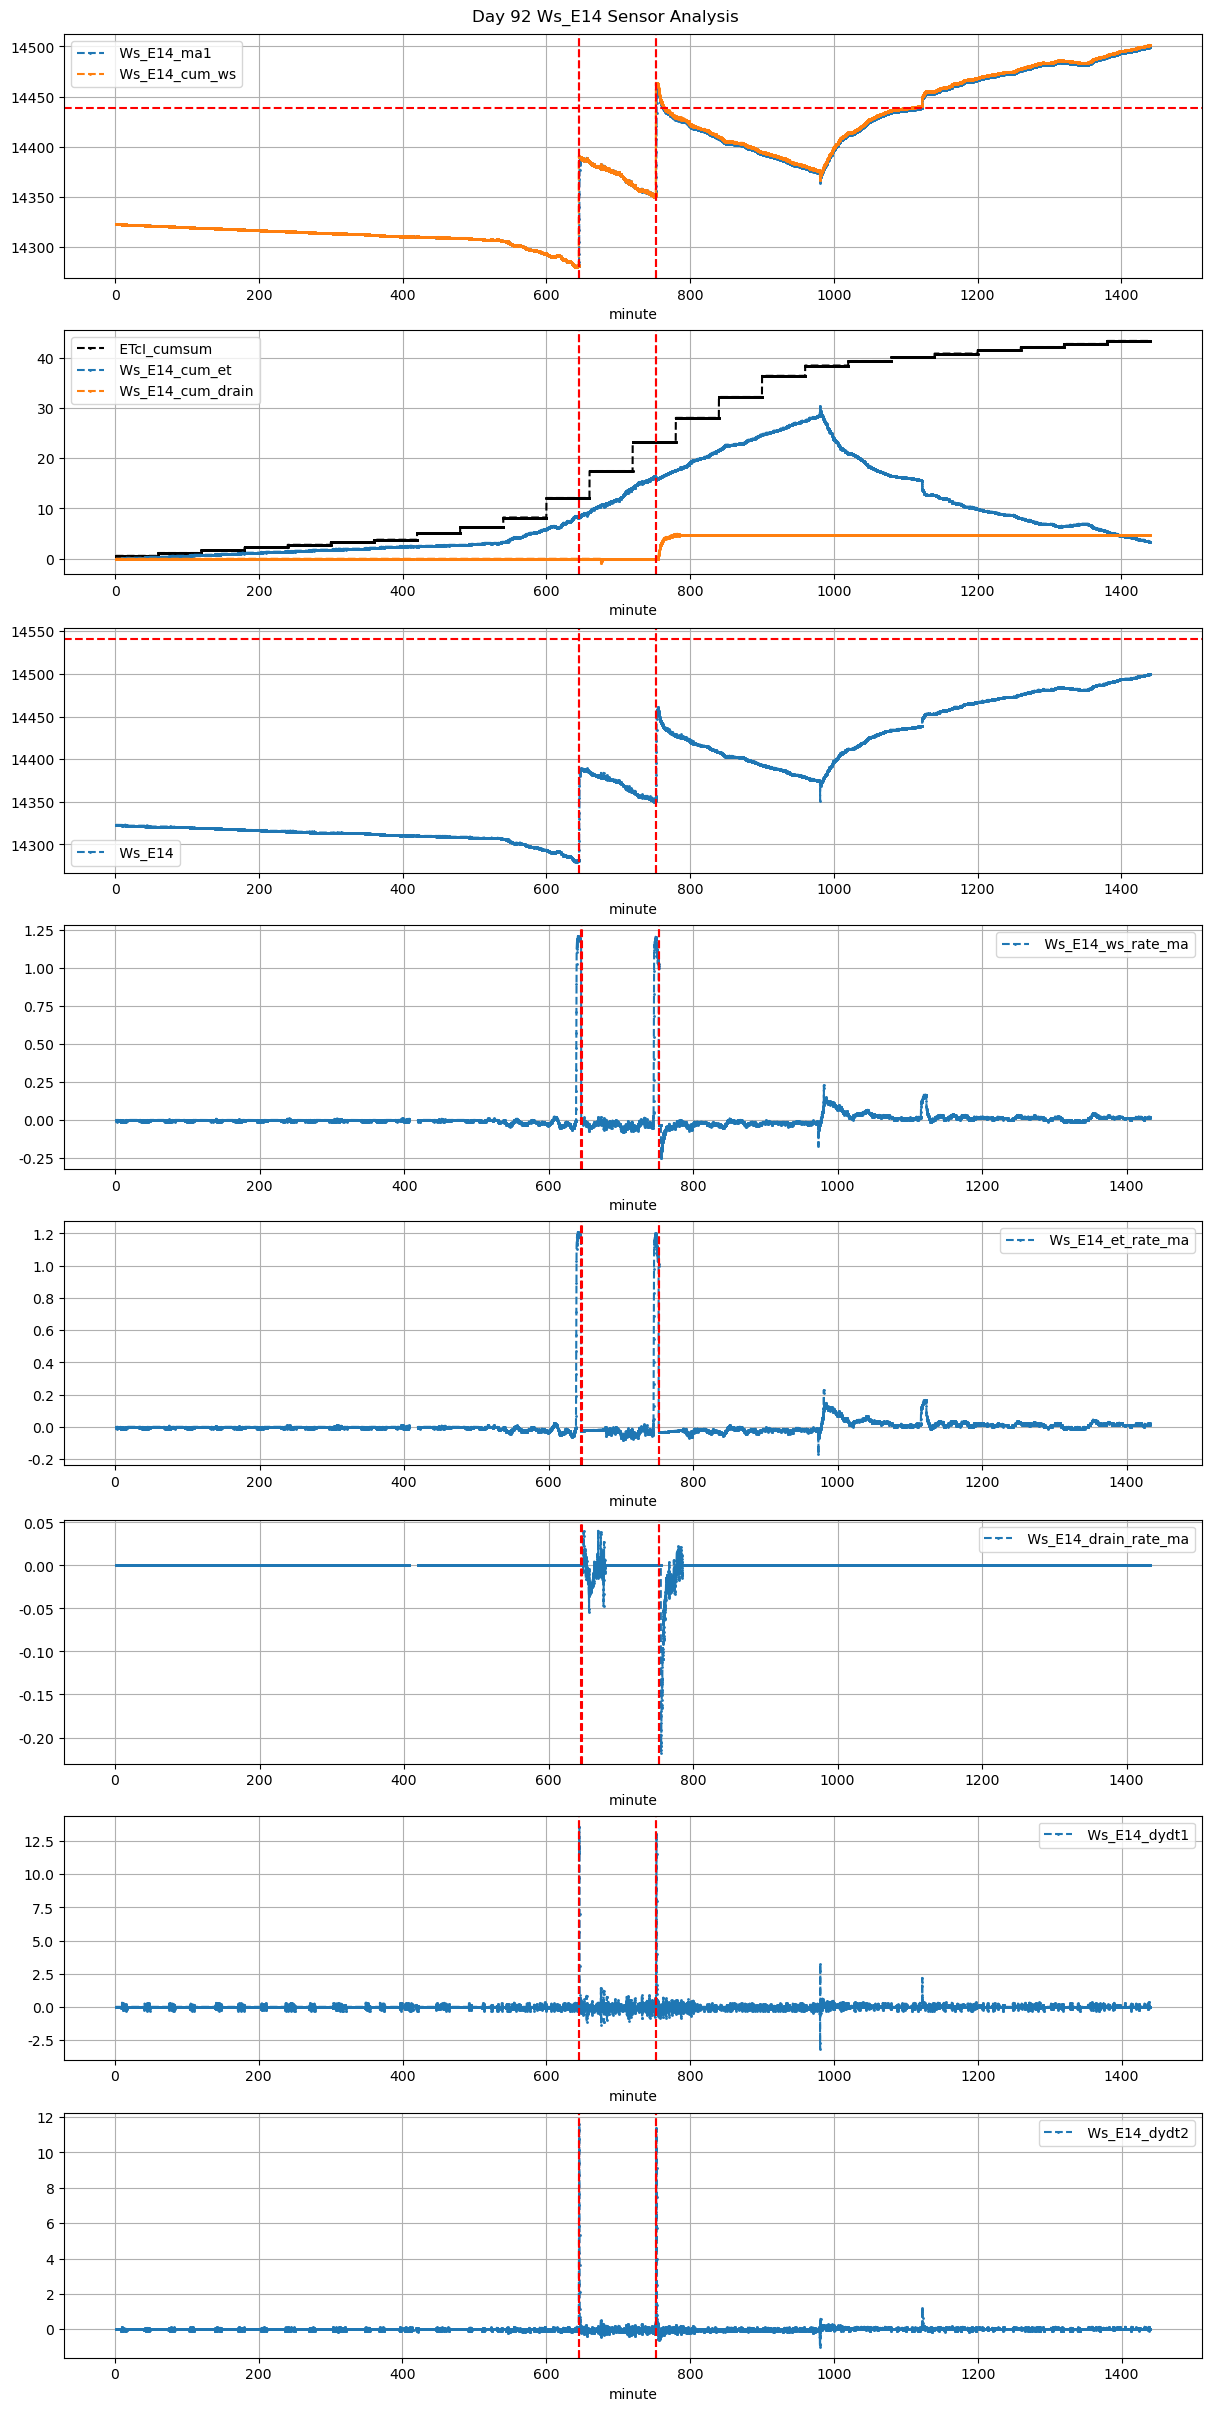
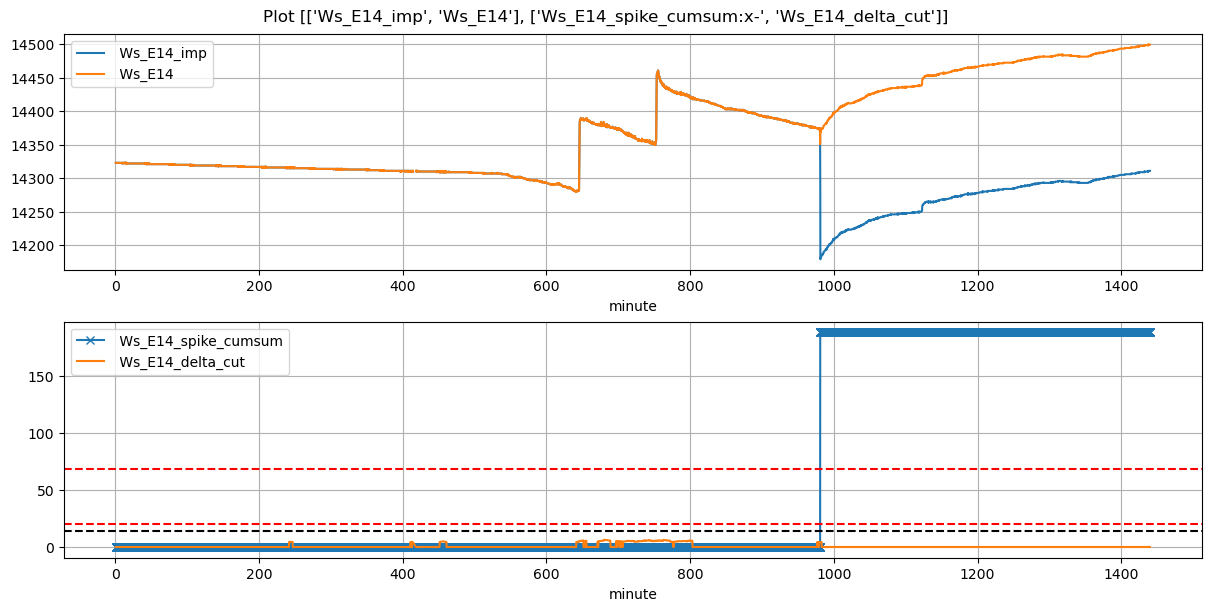
VI and VO Daily Summary
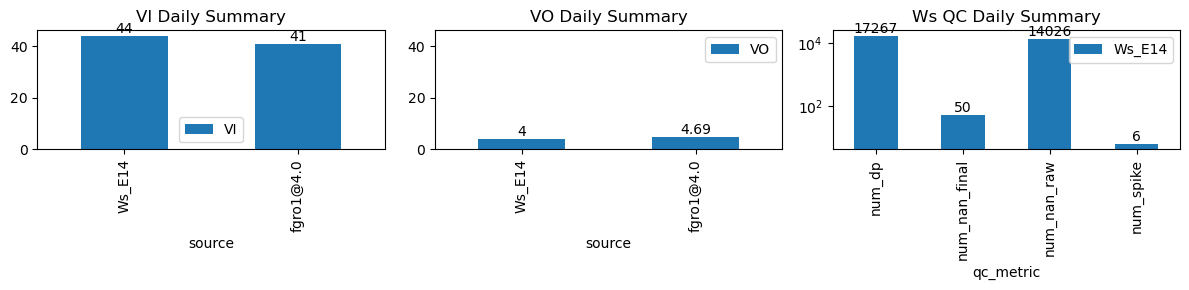
| ws_name | num_dp | num_nan_raw | num_nan_final | num_spike | cum_step_adj |
|---|---|---|---|---|---|
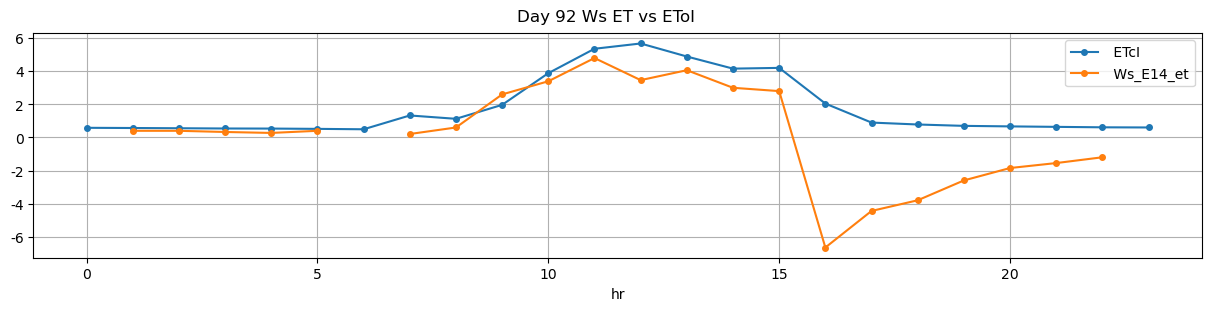
| Ws_E14 | 17,267 | 14,026 | 50 | 6 | 188.50 |
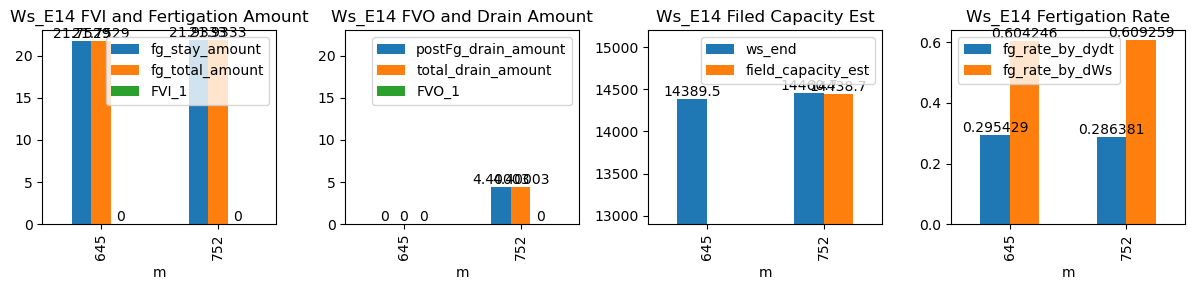
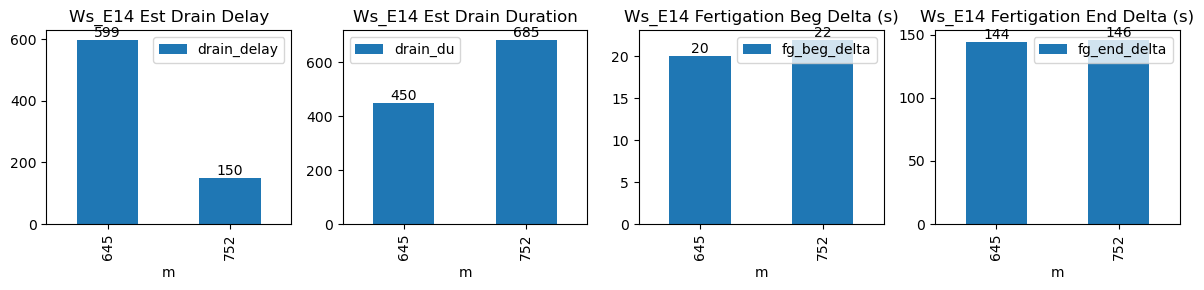
| ds | d | m | ws_name | prominence_cut | max_drain_du | fg_beg | fg_beg_est | fg_end | fg_end_est | ws_beg | ws_end | duc | pre_fg_et | post_fg_ws | post_drn_et | fg_rate_by_dydt | fg_rate_by_dWs | fg_stay_amount | enough_data | fg_beg_delta | fg_end_delta | fg_total_amount | fg_drain_amount | postFg_drain_amount | total_drain_amount | drain_du | drain_delay | drain_rate | field_capacity_est | FVI_1 | FVO_1 |
|---|---|---|---|---|---|---|---|---|---|---|---|---|---|---|---|---|---|---|---|---|---|---|---|---|---|---|---|---|---|---|---|
| 2026-01-06 10:45:00+08:00 | 92 | 645 | Ws_E14 | 0.260283 | 30 | 645.0 | 645.333333 | 645.6 | 648.083333 | 14280.500000 | 14390.0 | 36 | -0.022125 | -0.011024 | -0.012134 | 0.290286 | 0.608333 | 21.900000 | True | 20.0 | 149.0 | 21.900000 | 0.0 | 0.000000 | 0.000000 | 45 | 359 | -0.509331 | NaN | NaN | NaN |
| 2026-01-06 12:32:18+08:00 | 92 | 752 | Ws_E14 | 0.260283 | 30 | 752.3 | 752.666667 | 752.9 | 755.416667 | 14350.557143 | 14461.0 | 36 | -0.031308 | -0.181065 | -0.019994 | 0.279571 | 0.613571 | 22.088571 | True | 22.0 | 151.0 | 22.088571 | 0.0 | 5.015427 | 5.015427 | 60 | 186 | -0.635578 | 14435.922865 | NaN | NaN |