| 2026-01-07 10:40:00+08:00 |
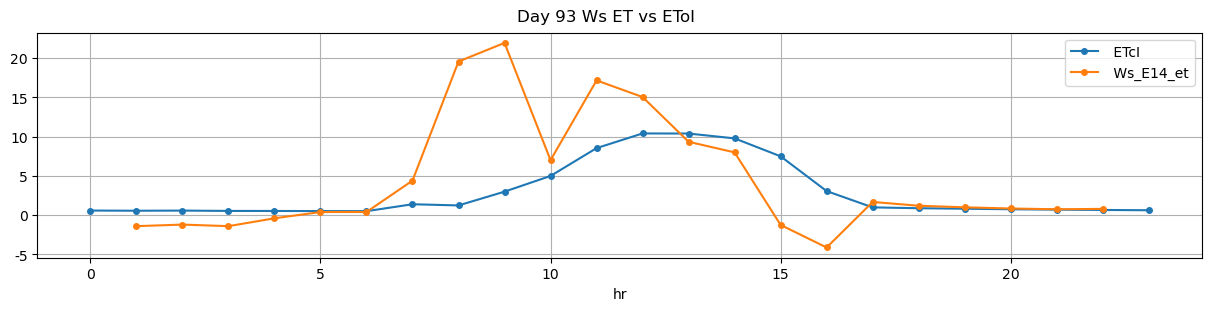
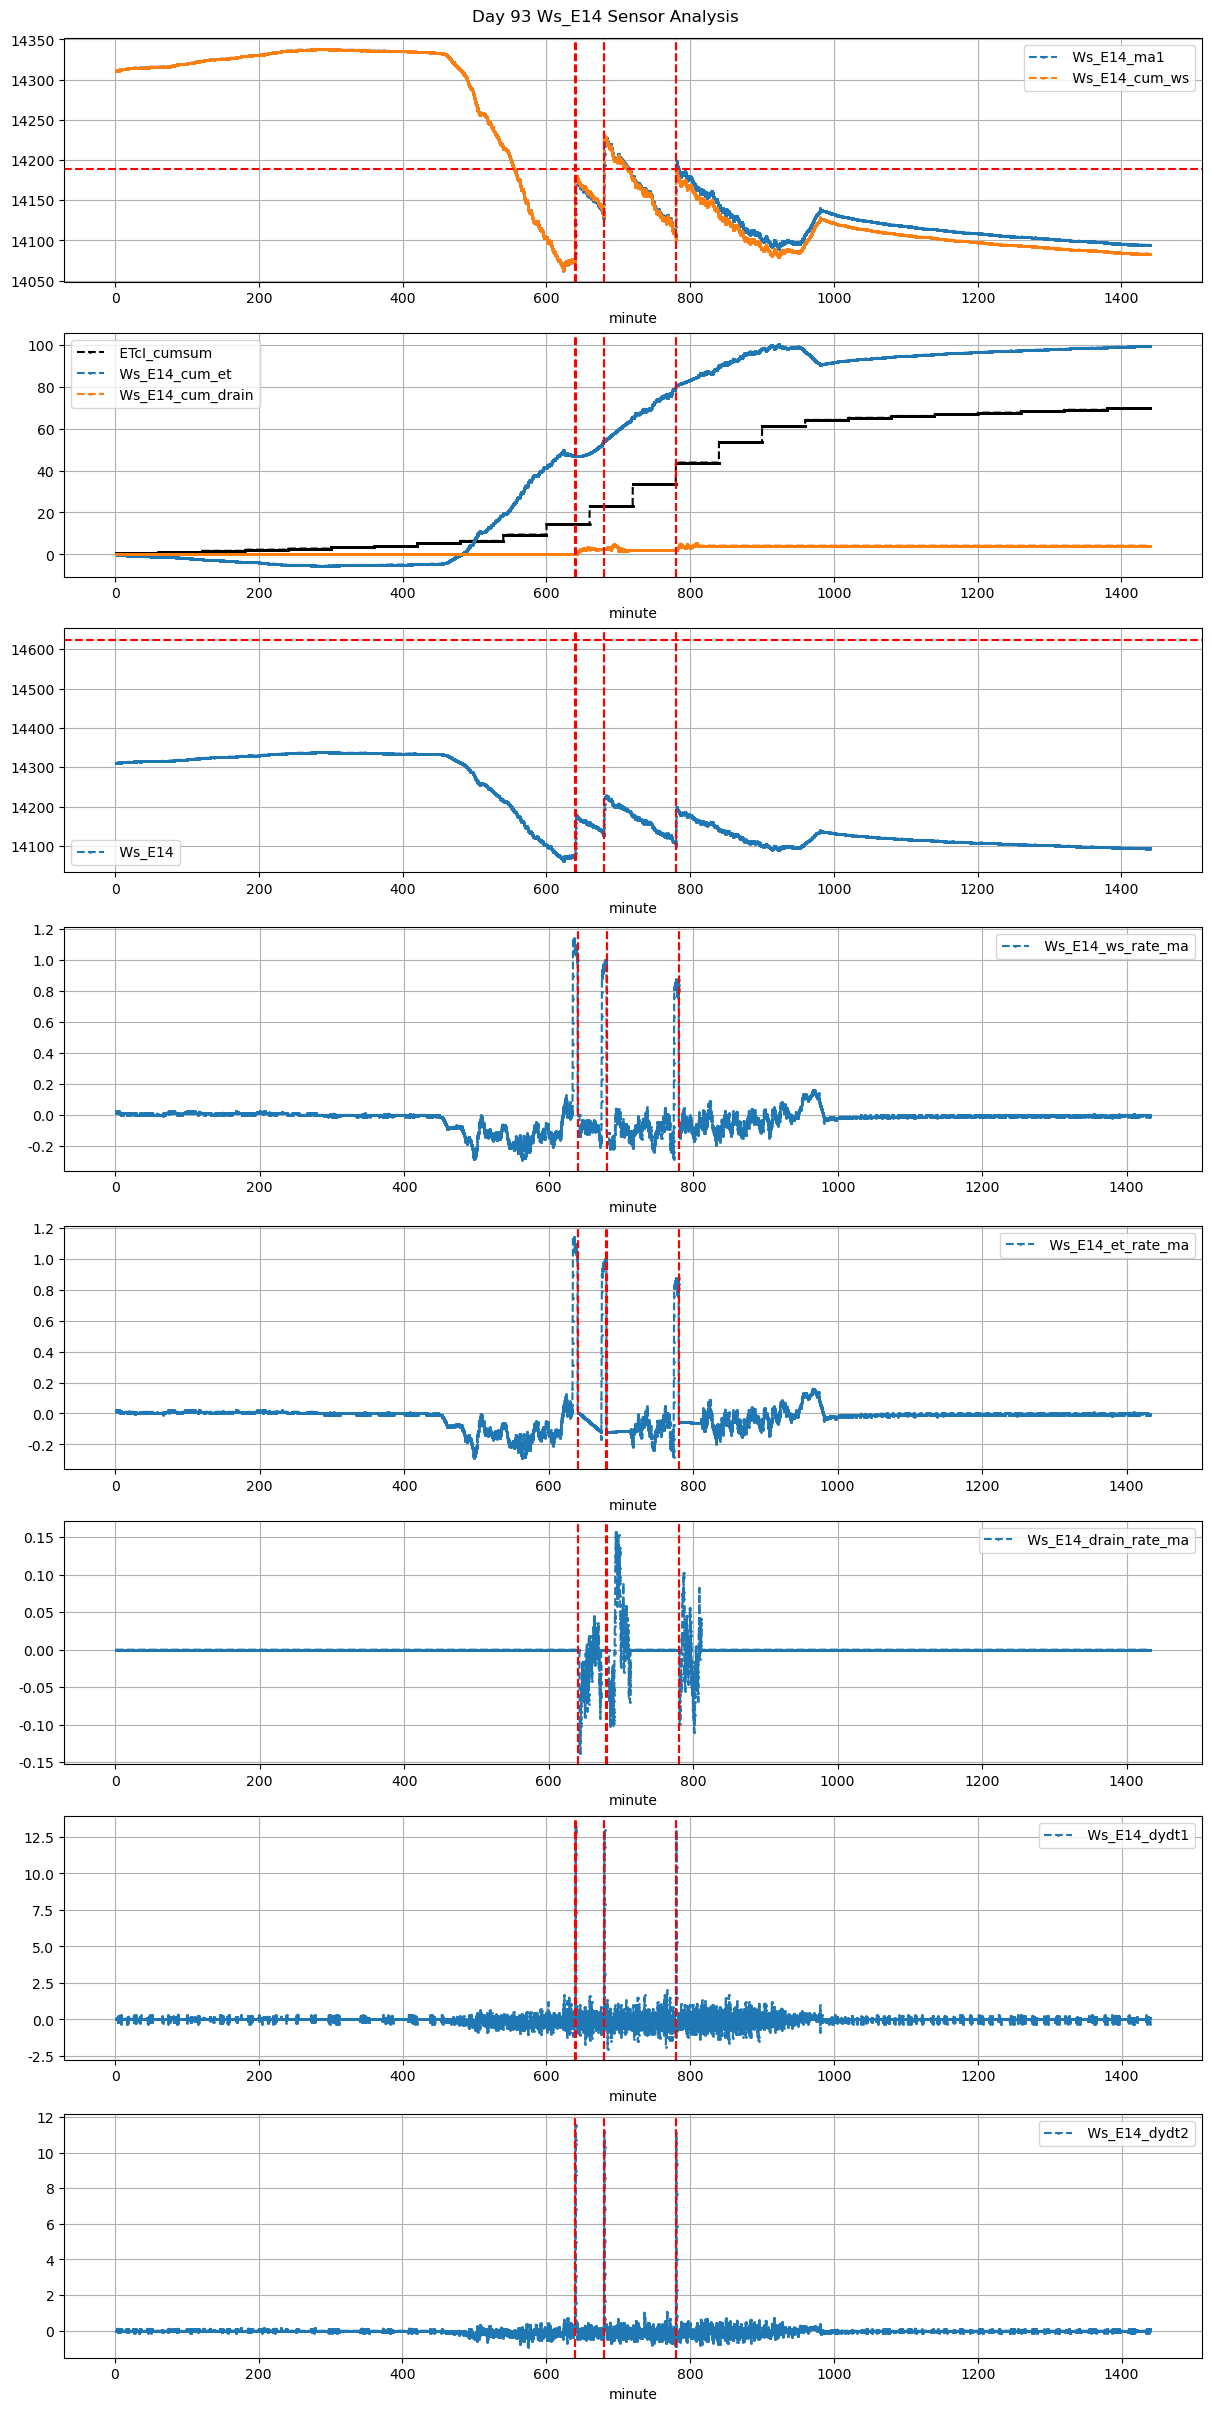
93 |
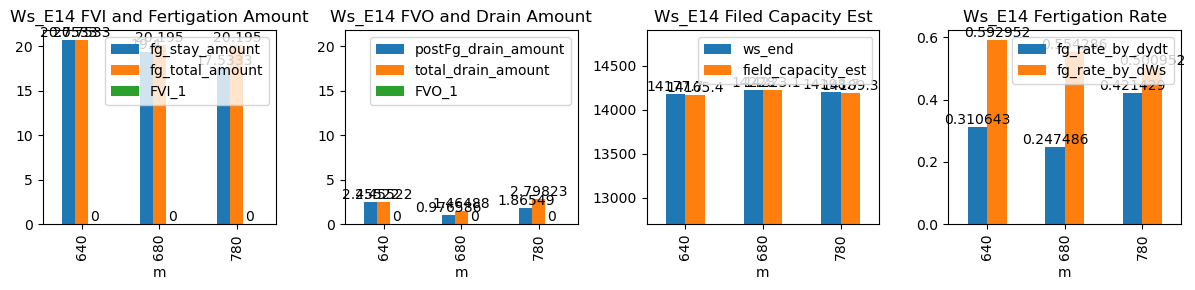
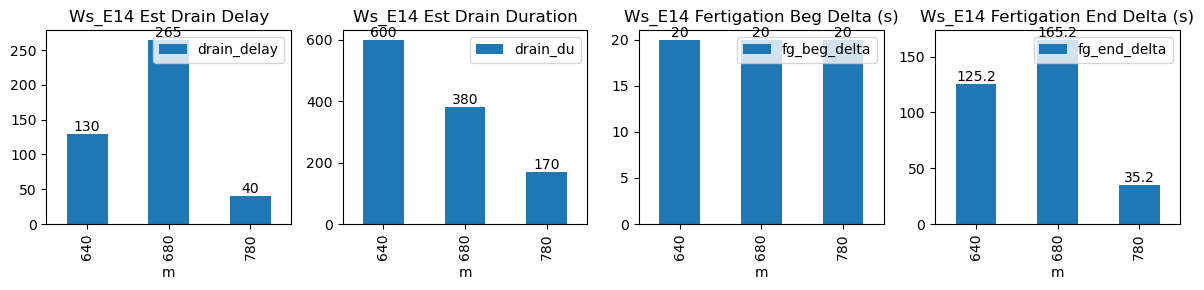
640 |
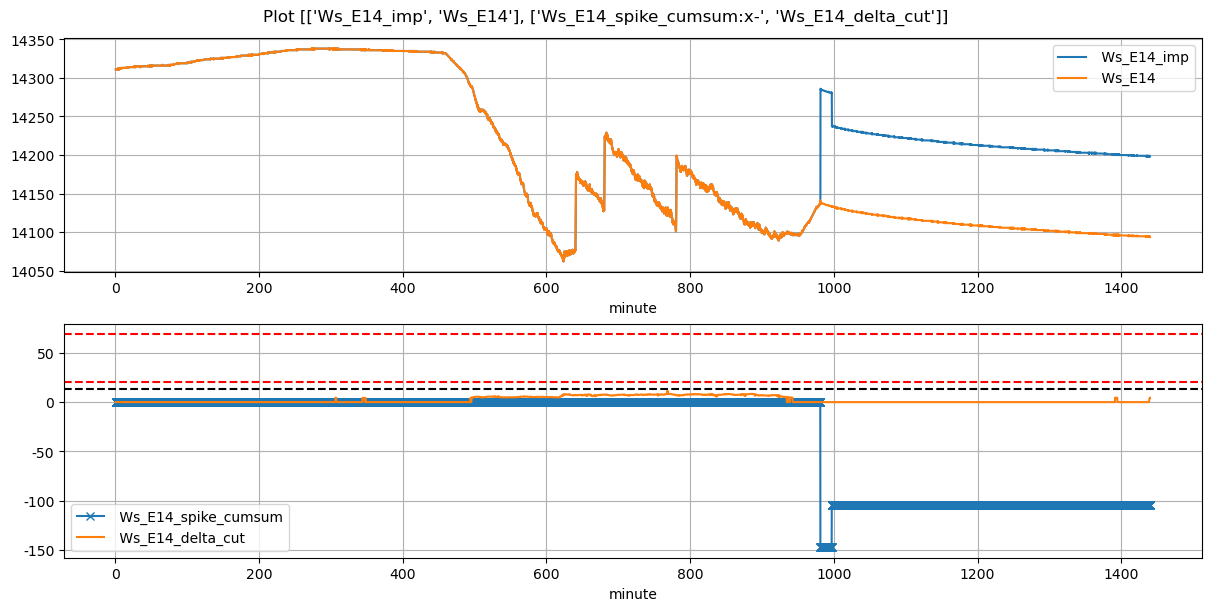
Ws_E14 |
0.620587 |
30 |
640.0 |
640.333333 |
640.58 |
642.666667 |
14074.0 |
14178.0 |
35 |
0.000000 |
-0.103264 |
-0.112176 |
0.310643 |
0.594286 |
20.80 |
True |
20.0 |
125.2 |
20.800 |
0.0 |
0 |
0.0 |
15 |
365 |
-0.976799 |
NaN |
NaN |
NaN |
| 2026-01-07 11:20:00+08:00 |
93 |
680 |
Ws_E14 |
0.620587 |
30 |
680.0 |
680.333333 |
680.58 |
683.416667 |
14130.3 |
14229.0 |
35 |
-0.149906 |
-0.140444 |
-0.101528 |
0.235686 |
0.564000 |
19.74 |
True |
20.0 |
170.2 |
20.195 |
0.0 |
0 |
0.0 |
9 |
270 |
-0.824571 |
NaN |
NaN |
NaN |
| 2026-01-07 13:00:00+08:00 |
93 |
780 |
Ws_E14 |
0.620587 |
30 |
780.0 |
780.333333 |
780.58 |
781.083333 |
14110.4 |
14199.0 |
35 |
-0.204543 |
-0.124907 |
-0.057801 |
0.421857 |
0.506286 |
17.72 |
True |
20.0 |
30.2 |
20.195 |
0.0 |
0 |
0.0 |
30 |
875 |
-0.749802 |
NaN |
NaN |
NaN |