| 2026-01-08 11:10:00+08:00 |
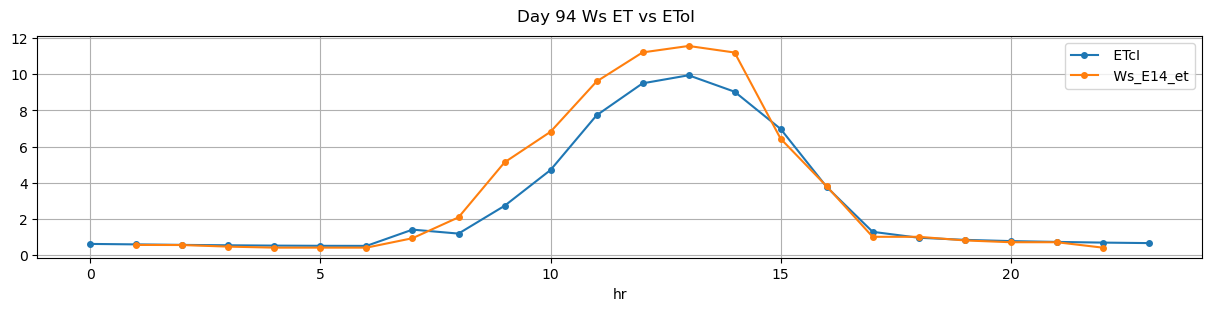
94 |
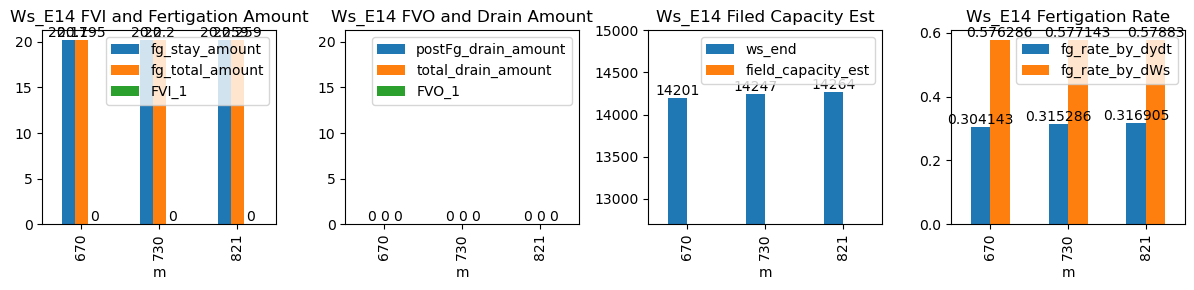
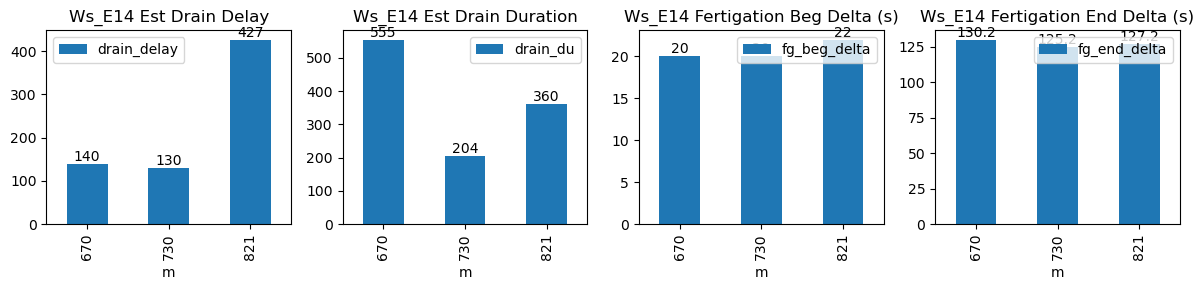
670 |
Ws_E14 |
0.280342 |
30 |
670.00 |
670.333333 |
670.58 |
672.666667 |
14099.900000 |
14201.0 |
35 |
-0.080497 |
-0.123854 |
-0.083472 |
0.308286 |
0.577714 |
20.220000 |
True |
20.0 |
125.2 |
20.220000 |
0.0 |
0 |
0.0 |
15 |
220 |
-0.335320 |
NaN |
NaN |
NaN |
| 2026-01-08 12:10:00+08:00 |
94 |
730 |
Ws_E14 |
0.280342 |
30 |
730.00 |
730.333333 |
730.58 |
731.916667 |
14145.542857 |
14247.0 |
35 |
-0.062500 |
-0.127083 |
-0.092153 |
0.378095 |
0.579755 |
20.291429 |
True |
20.0 |
80.2 |
20.291429 |
0.0 |
0 |
0.0 |
19 |
510 |
-0.360585 |
NaN |
NaN |
NaN |
| 2026-01-08 13:41:03+08:00 |
94 |
821 |
Ws_E14 |
0.280342 |
30 |
821.05 |
821.416667 |
821.63 |
823.500000 |
14162.409524 |
14264.0 |
35 |
-0.050671 |
-0.076580 |
-0.067130 |
0.321905 |
0.580517 |
20.318095 |
True |
22.0 |
112.2 |
20.318095 |
0.0 |
0 |
0.0 |
35 |
172 |
-0.459033 |
NaN |
NaN |
NaN |