| 2026-01-21 11:10:00+08:00 |
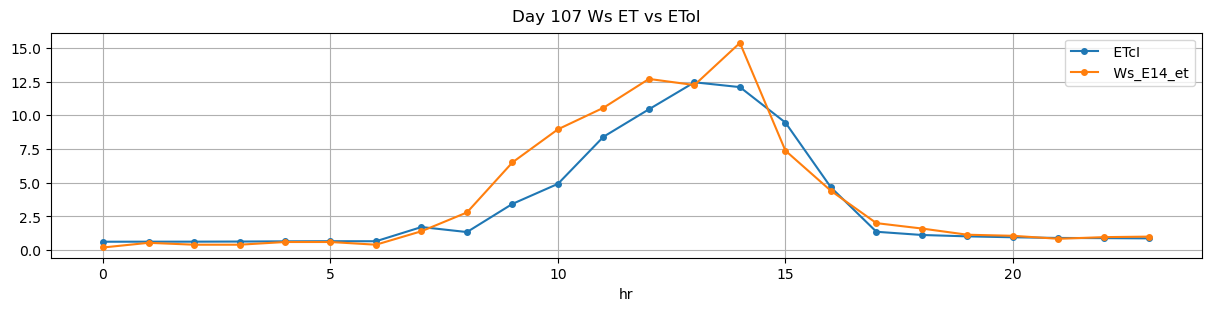
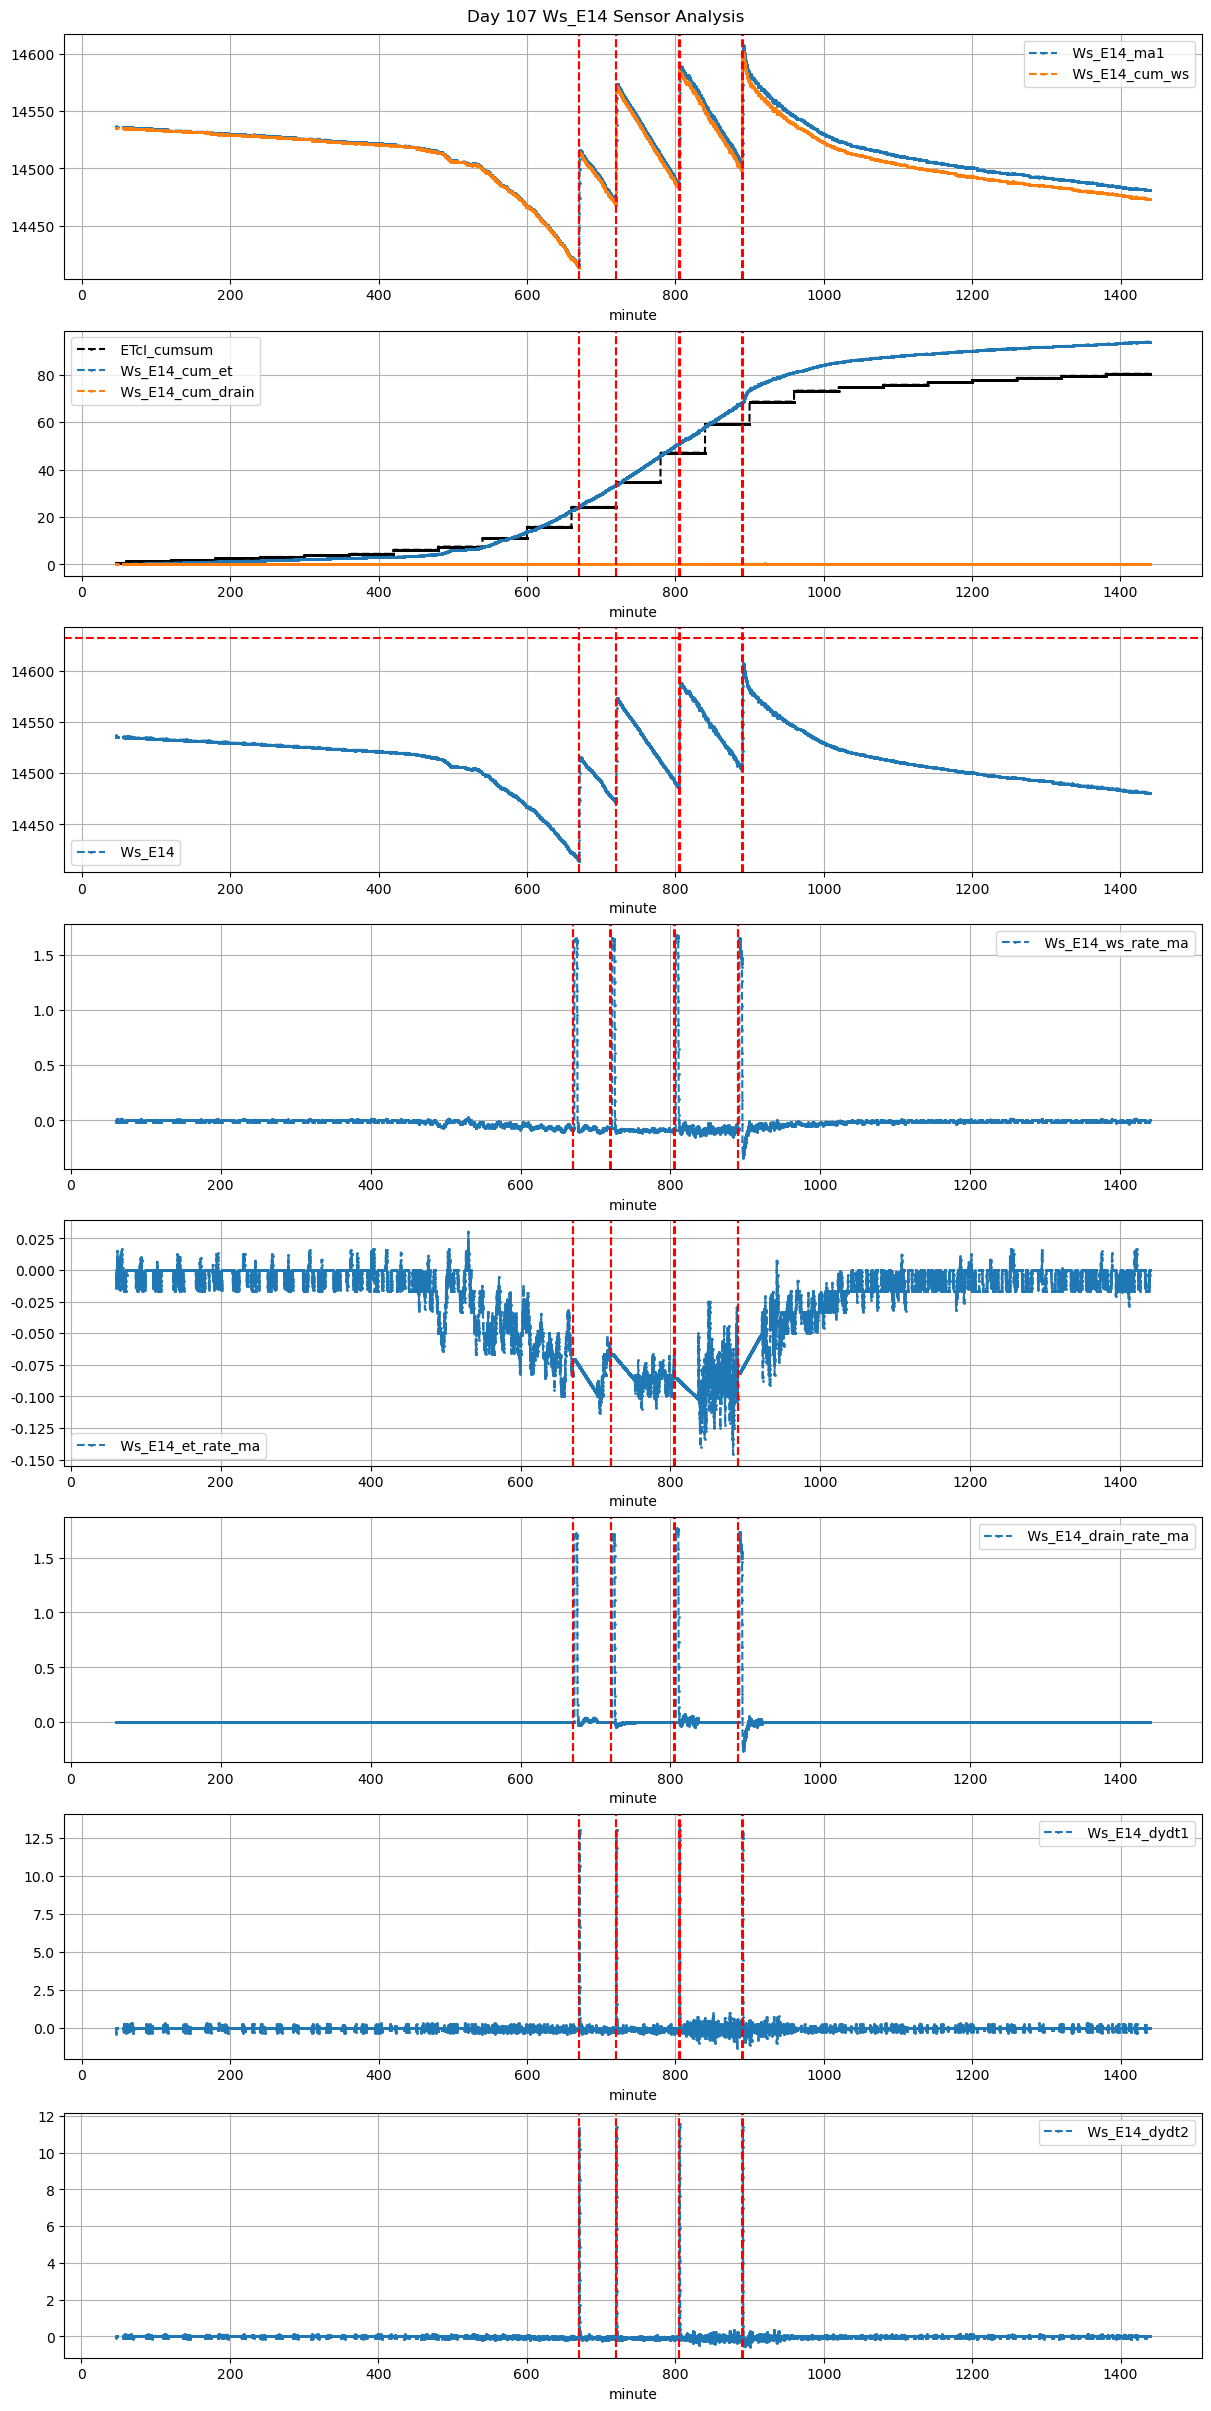
107 |
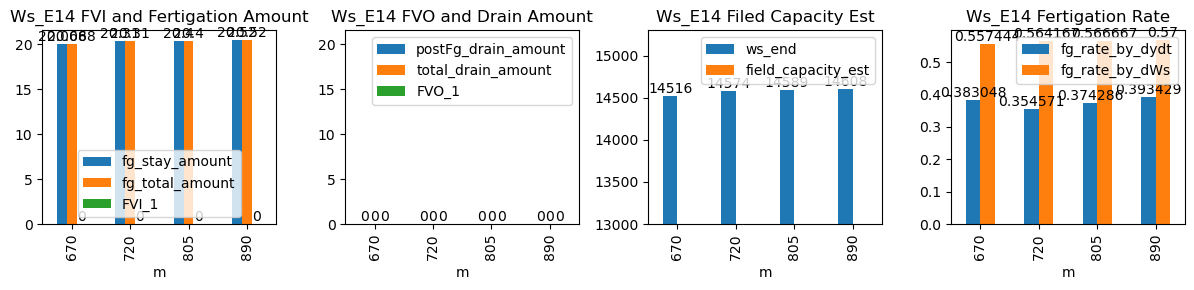
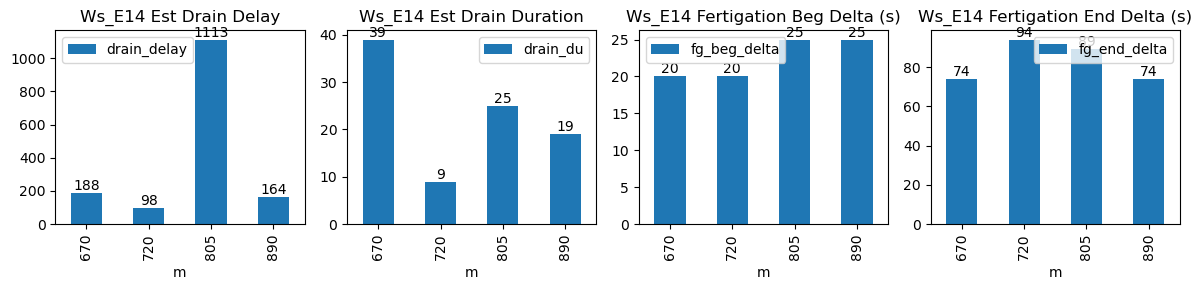
670 |
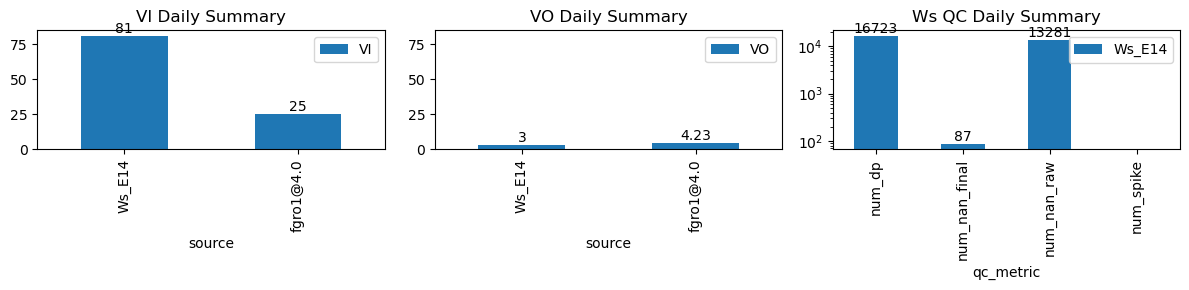
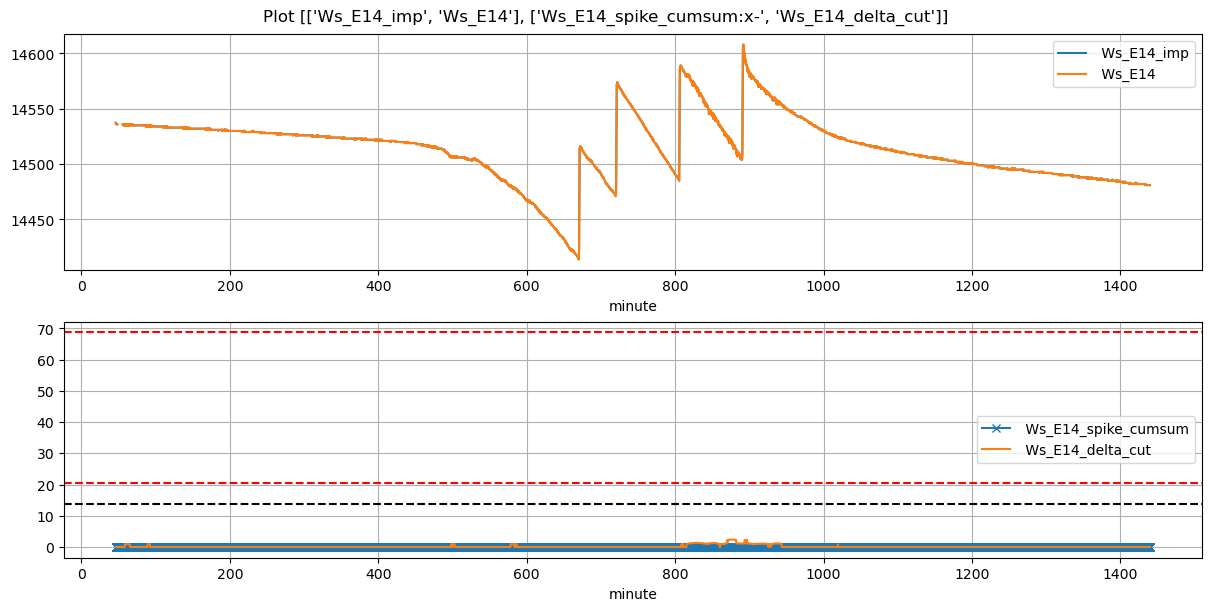
Ws_E14 |
0.283659 |
30 |
670.0 |
670.333333 |
670.6 |
671.833333 |
14415.66 |
14516.0 |
36 |
-0.070339 |
-0.088935 |
-0.097829 |
0.383048 |
0.557444 |
20.068 |
True |
20.0 |
74.0 |
20.068 |
0.0 |
0 |
0.0 |
39 |
188 |
-0.201447 |
NaN |
NaN |
NaN |
| 2026-01-21 12:00:00+08:00 |
107 |
720 |
Ws_E14 |
0.283659 |
30 |
720.0 |
720.333333 |
720.6 |
722.166667 |
14472.45 |
14574.0 |
36 |
-0.066013 |
-0.098614 |
-0.086867 |
0.354571 |
0.564167 |
20.310 |
True |
20.0 |
94.0 |
20.310 |
0.0 |
0 |
0.0 |
9 |
98 |
-0.163098 |
NaN |
NaN |
NaN |
| 2026-01-21 13:25:00+08:00 |
107 |
805 |
Ws_E14 |
0.283659 |
30 |
805.0 |
805.416667 |
805.6 |
807.083333 |
14487.00 |
14589.0 |
36 |
-0.085040 |
-0.089301 |
-0.101905 |
0.374286 |
0.566667 |
20.400 |
True |
25.0 |
89.0 |
20.400 |
0.0 |
0 |
0.0 |
25 |
1113 |
-0.528098 |
NaN |
NaN |
NaN |
| 2026-01-21 14:50:00+08:00 |
107 |
890 |
Ws_E14 |
0.283659 |
30 |
890.0 |
890.416667 |
890.6 |
891.833333 |
14505.40 |
14608.0 |
36 |
-0.081719 |
-0.214465 |
-0.049954 |
0.393429 |
0.570000 |
20.520 |
True |
25.0 |
74.0 |
20.520 |
0.0 |
0 |
0.0 |
19 |
164 |
-0.587938 |
NaN |
NaN |
NaN |