| 2026-01-21 11:10:00+08:00 |
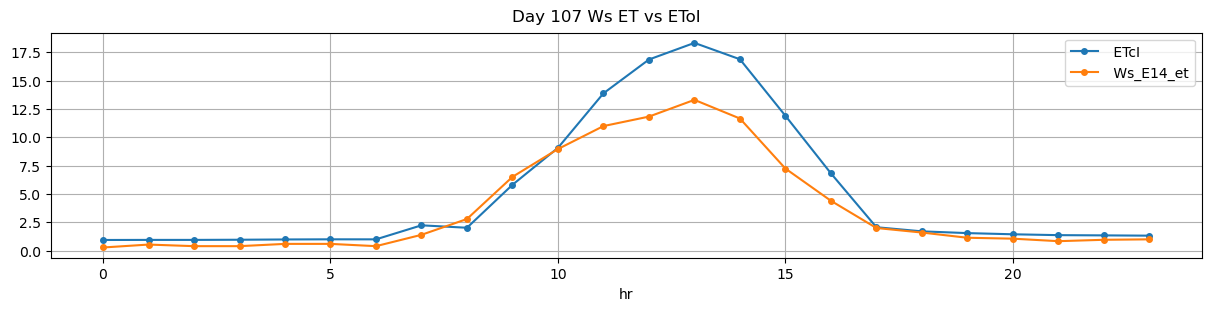
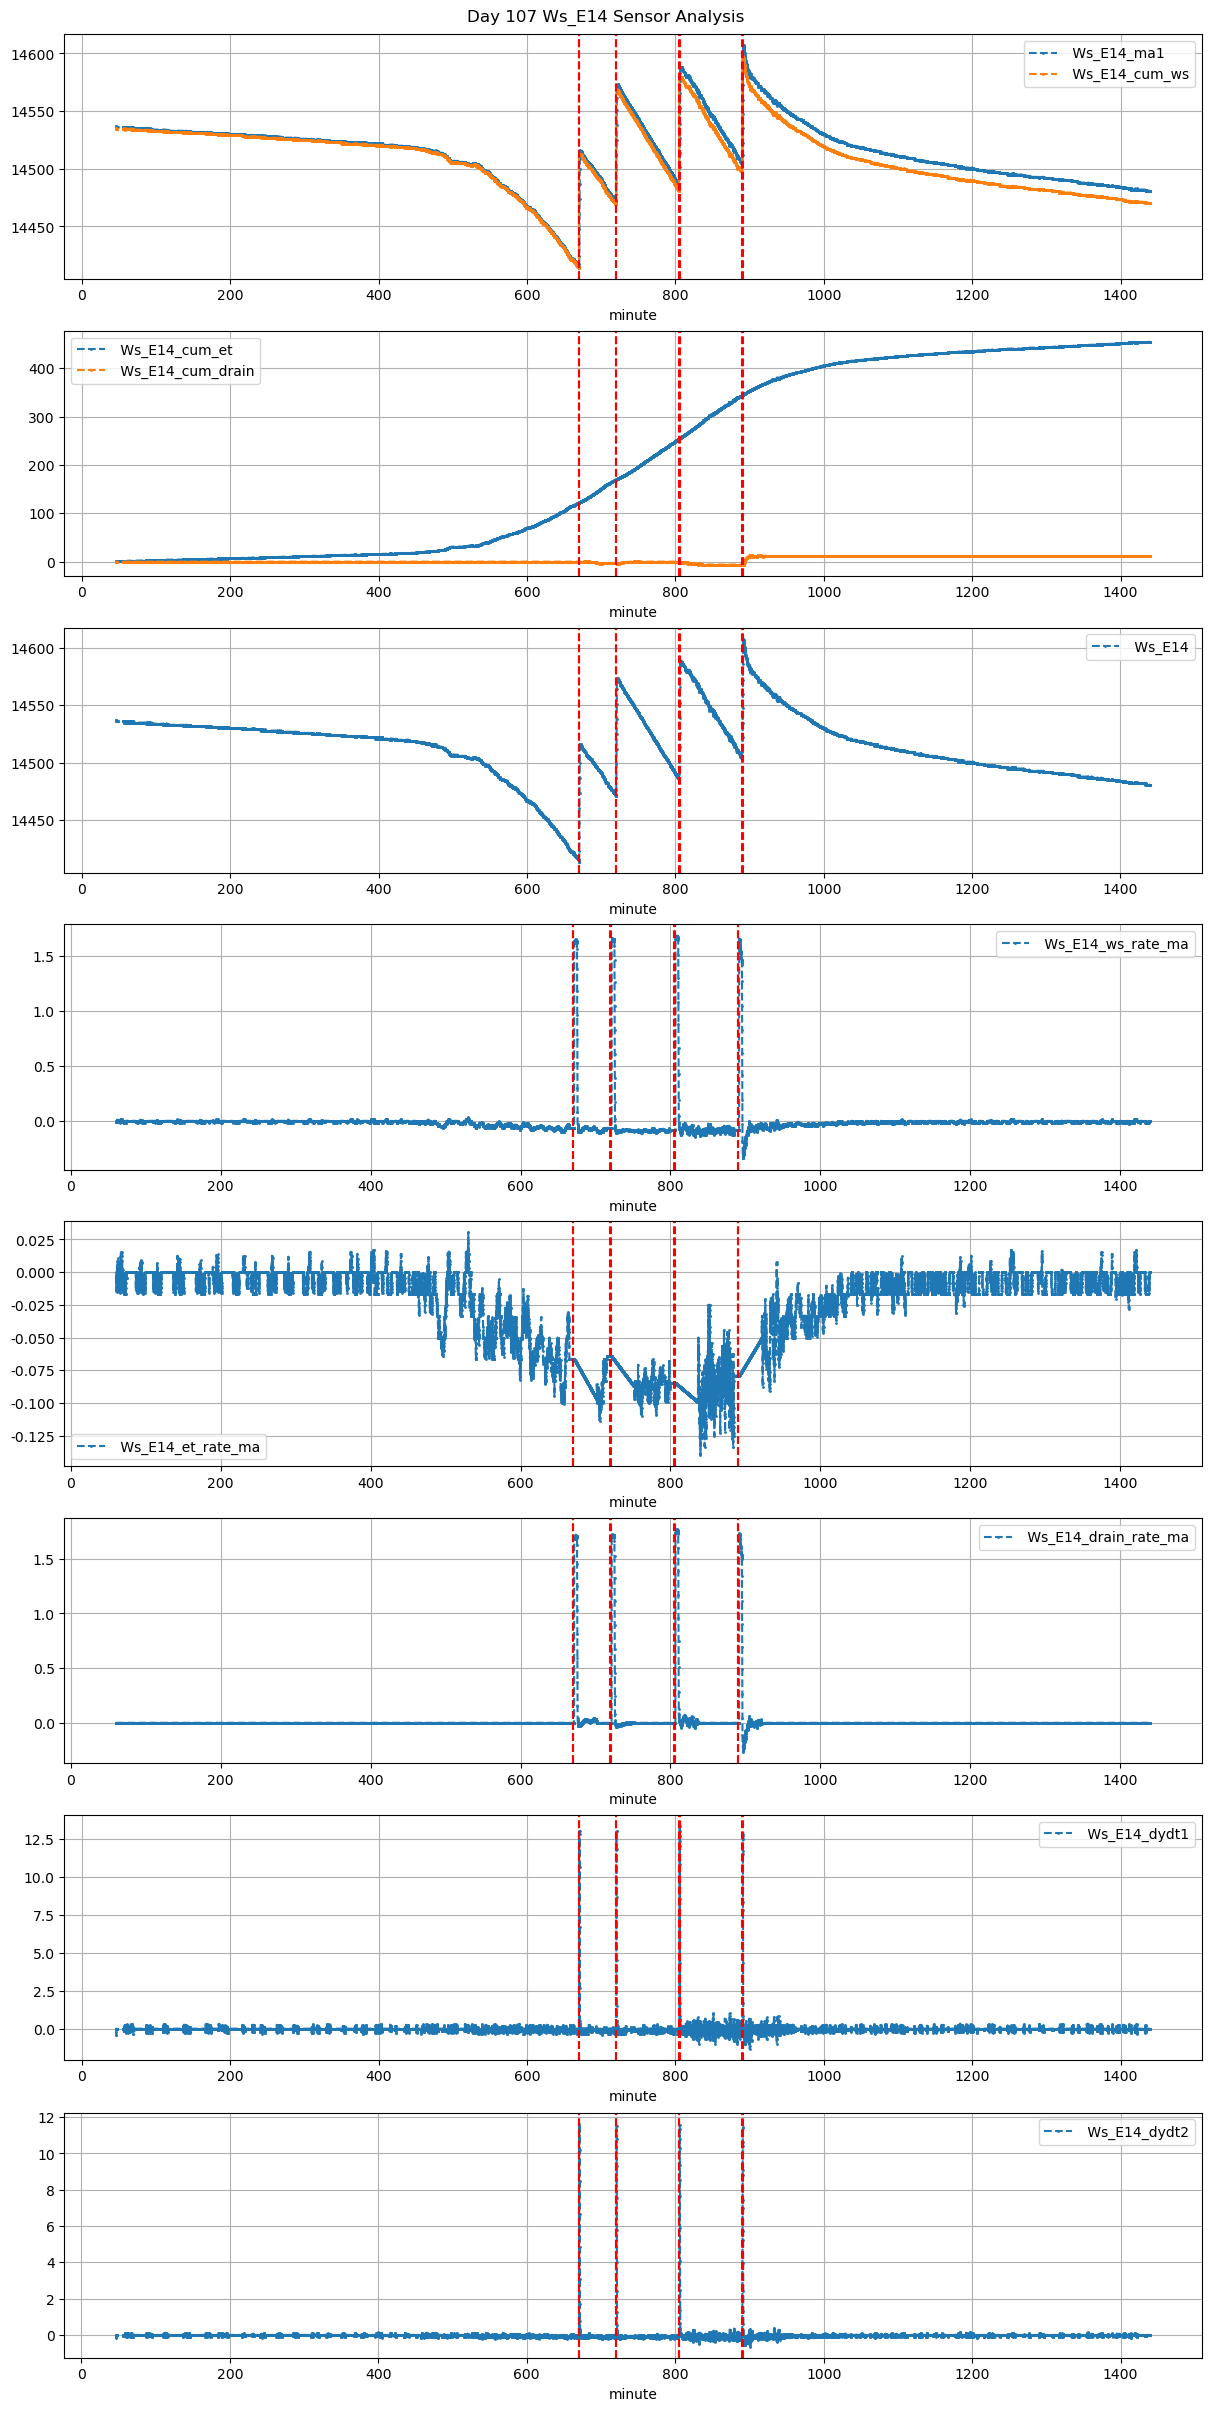
107 |
670 |
Ws_E14 |
0.287362 |
30 |
670.0 |
670.333333 |
670.6 |
671.583333 |
NaN |
NaN |
NaN |
14417.0 |
14516.0 |
36 |
-0.066215 |
-0.089306 |
-0.097083 |
0.408571 |
0.550000 |
19.8 |
20.0 |
59.0 |
19.8 |
0.0 |
-0.737355 |
NaN |
-0.737355 |
| 2026-01-21 12:00:00+08:00 |
107 |
720 |
Ws_E14 |
0.287362 |
30 |
720.0 |
720.250000 |
720.6 |
721.583333 |
NaN |
NaN |
NaN |
14474.0 |
14574.0 |
36 |
-0.064407 |
-0.097083 |
-0.087377 |
0.404857 |
0.555556 |
20.0 |
15.0 |
59.0 |
20.0 |
0.0 |
0.709854 |
NaN |
0.709854 |
| 2026-01-21 13:25:00+08:00 |
107 |
805 |
Ws_E14 |
0.287362 |
30 |
805.0 |
805.333333 |
805.6 |
806.666667 |
NaN |
NaN |
NaN |
14489.0 |
14589.0 |
36 |
-0.084663 |
-0.090694 |
-0.099306 |
0.404000 |
0.555556 |
20.0 |
20.0 |
64.0 |
20.0 |
0.0 |
-1.194945 |
NaN |
-1.194945 |
| 2026-01-21 14:50:00+08:00 |
107 |
890 |
Ws_E14 |
0.287362 |
30 |
890.0 |
890.333333 |
890.6 |
891.666667 |
NaN |
NaN |
NaN |
14507.0 |
14608.0 |
36 |
-0.079237 |
-0.221806 |
-0.050417 |
0.406571 |
0.561111 |
20.2 |
20.0 |
64.0 |
20.2 |
0.0 |
3.450910 |
NaN |
3.450910 |