| 2026-01-25 08:03:15+08:00 |
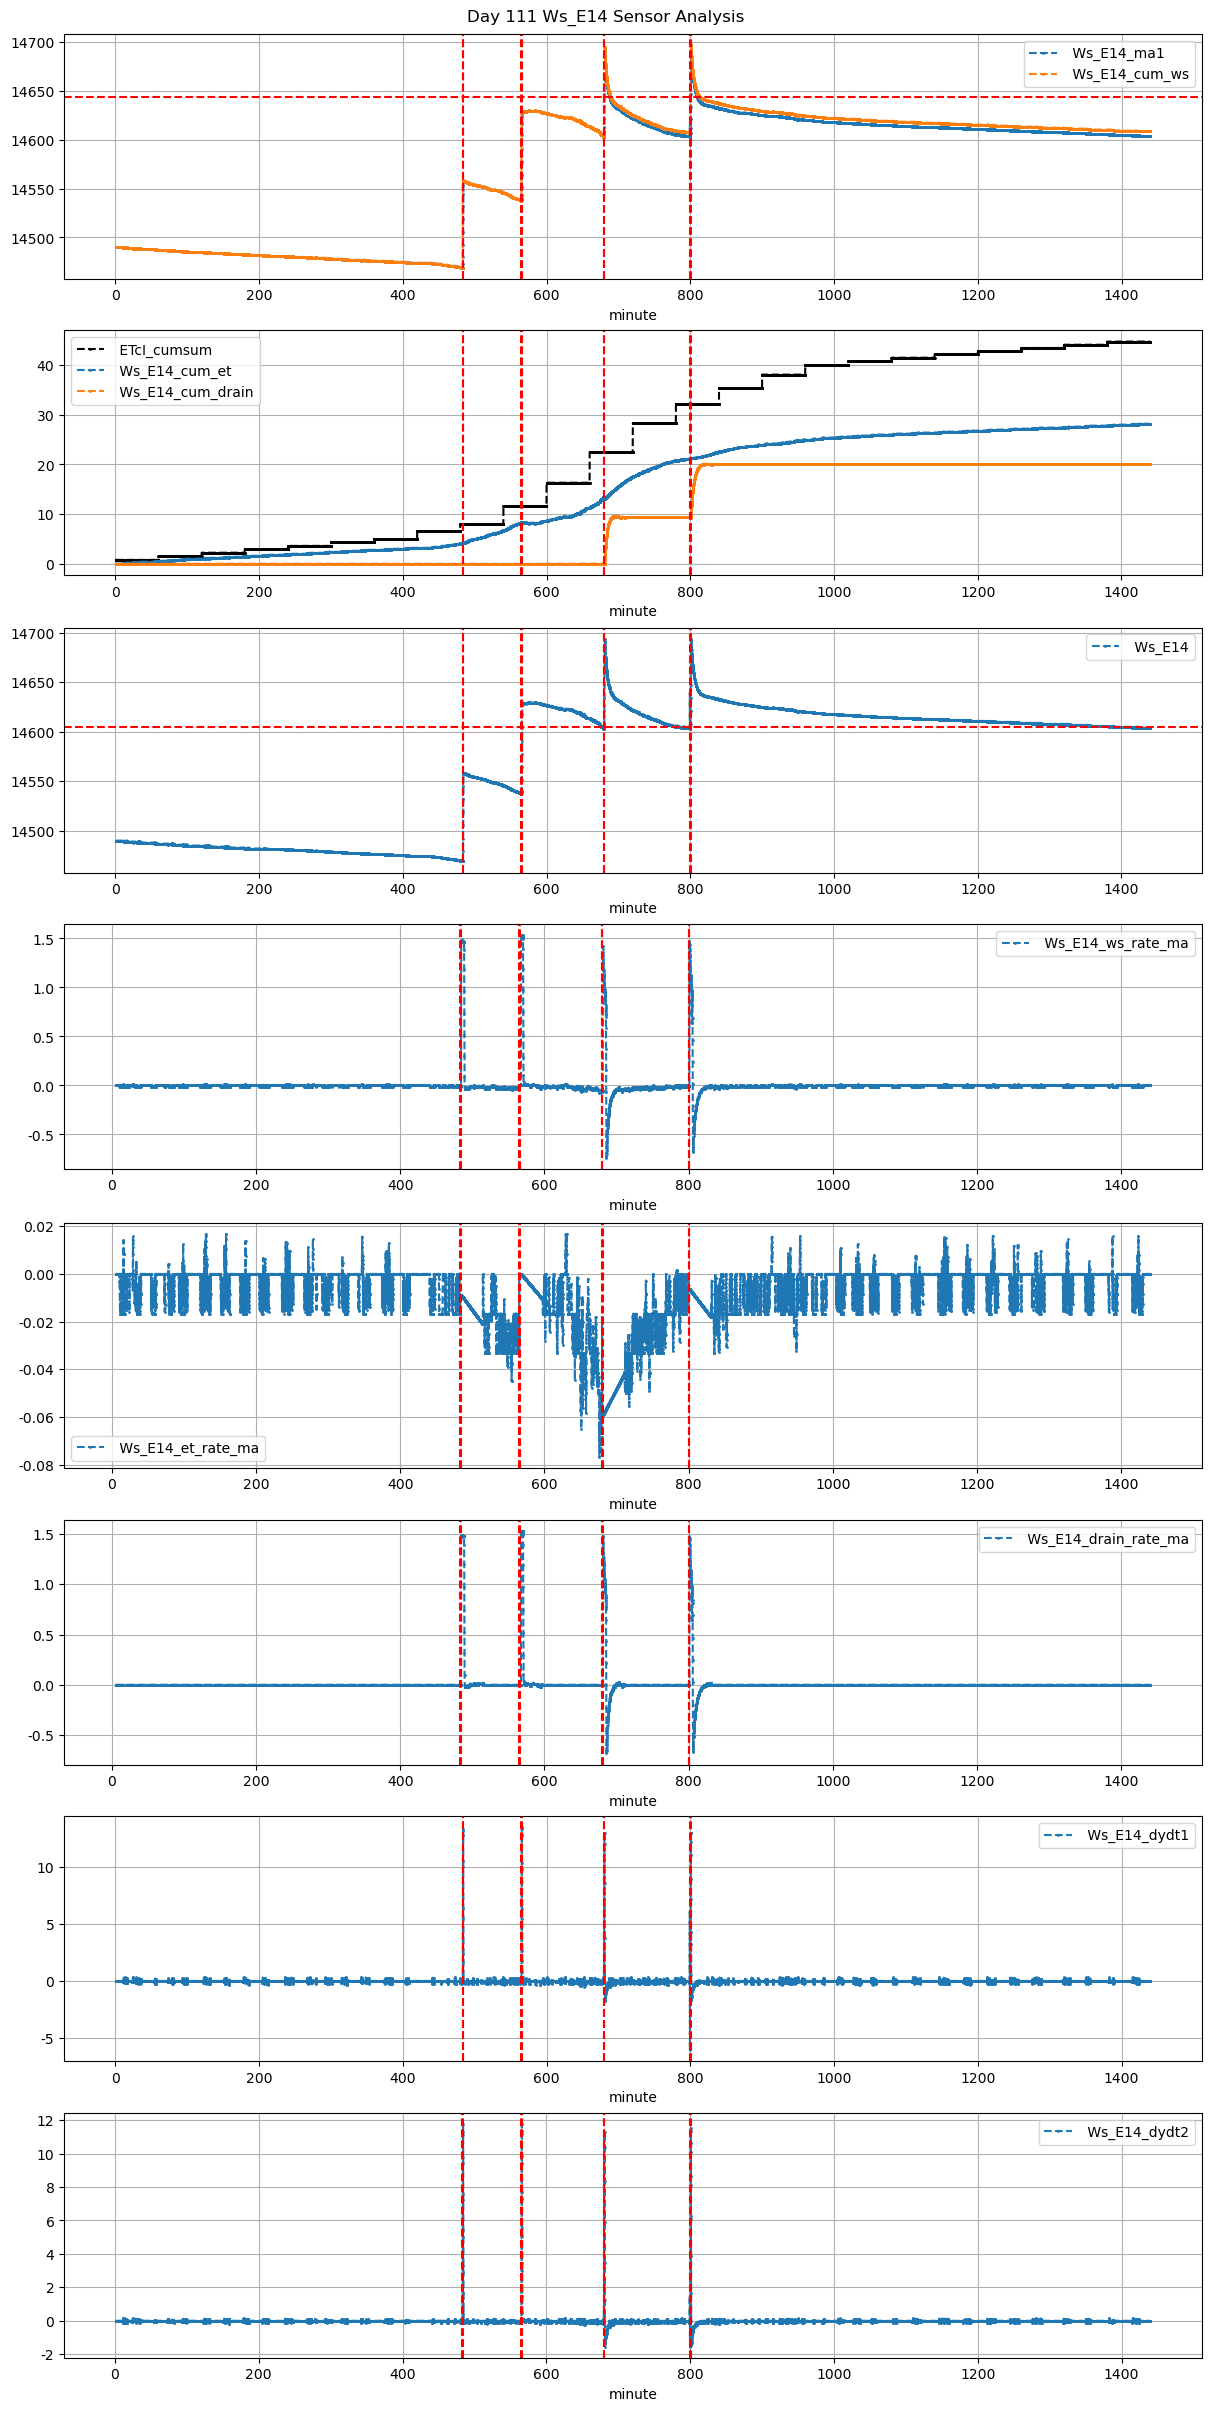
111 |
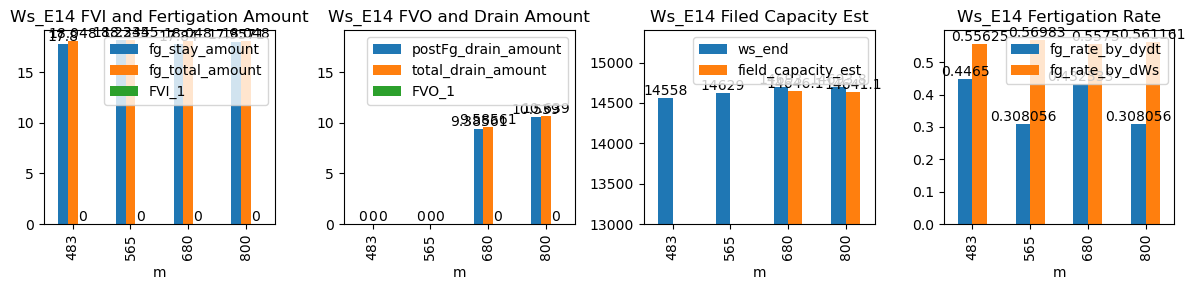
483 |
Ws_E14 |
0.381953 |
30 |
483.25 |
483.666667 |
483.78 |
484.416667 |
14469.000000 |
14558.000000 |
32 |
-0.008828 |
-0.031227 |
-0.021111 |
0.446500 |
0.556250 |
17.800000 |
True |
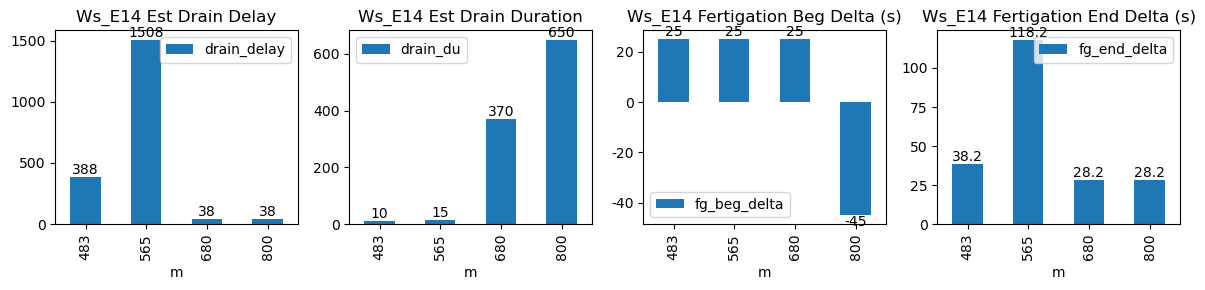
25.0 |
38.2 |
18.048000 |
0.0 |
0.000000 |
0.000000 |
10 |
388 |
-0.258973 |
NaN |
NaN |
NaN |
| 2026-01-25 09:25:00+08:00 |
111 |
565 |
Ws_E14 |
0.381953 |
30 |
565.00 |
565.416667 |
565.53 |
567.500000 |
14537.827273 |
14629.000000 |
32 |
-0.022552 |
0.000000 |
-0.010667 |
0.308056 |
0.569830 |
18.234545 |
True |
25.0 |
118.2 |
18.234545 |
0.0 |
0.000000 |
0.000000 |
15 |
1508 |
-0.315056 |
NaN |
NaN |
NaN |
| 2026-01-25 11:20:00+08:00 |
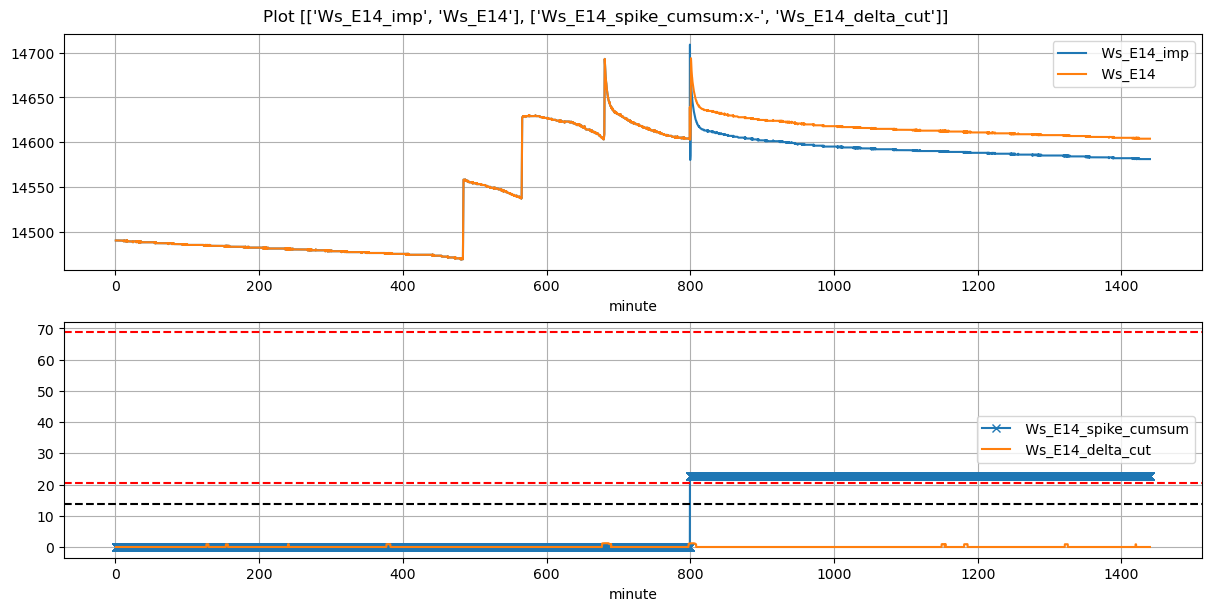
111 |
680 |
Ws_E14 |
0.381953 |
30 |
680.00 |
680.416667 |
680.53 |
681.000000 |
14603.800000 |
14693.000000 |
32 |
-0.059251 |
-0.384444 |
-0.041713 |
0.432333 |
0.557500 |
17.840000 |
True |
25.0 |
28.2 |
18.048000 |
0.2 |
9.385610 |
9.585610 |
370 |
38 |
-0.942038 |
14646.071949 |
NaN |
NaN |
| 2026-01-25 13:20:00+08:00 |
111 |
800 |
Ws_E14 |
0.381953 |
30 |
800.00 |
799.250000 |
800.53 |
801.000000 |
14604.000000 |
14693.785714 |
32 |
-0.006356 |
-0.366157 |
-0.018098 |
0.308056 |
0.561161 |
17.957143 |
True |
-45.0 |
28.2 |
18.048000 |
0.1 |
10.538952 |
10.638952 |
650 |
38 |
-0.972410 |
14641.090954 |
NaN |
NaN |