VI and VO Daily Summary
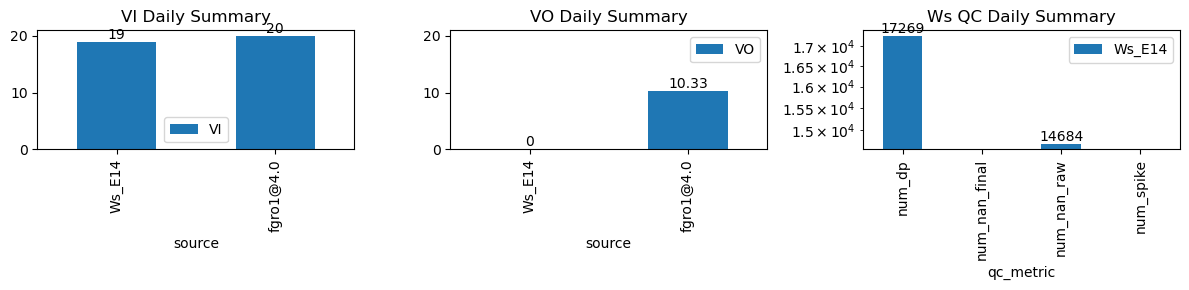
| ws_name | num_dp | num_nan_raw | num_nan_final | num_spike | cum_step_adj |
|---|---|---|---|---|---|
| Ws_E14 | 17,269 | 14,684 | 0 | 0 | 0.00 |
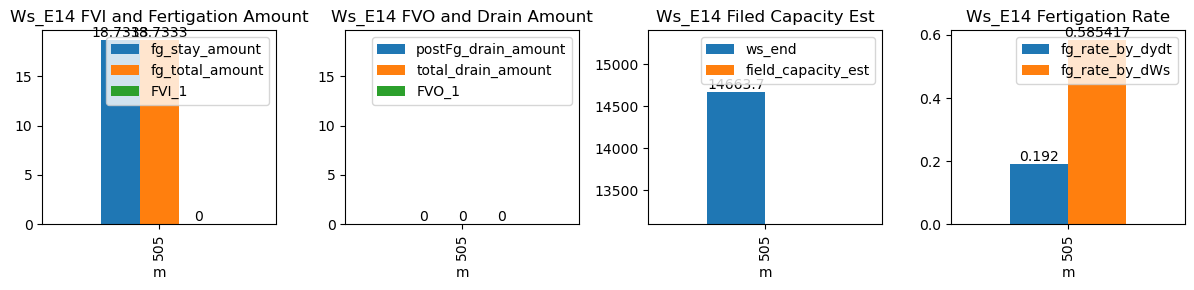
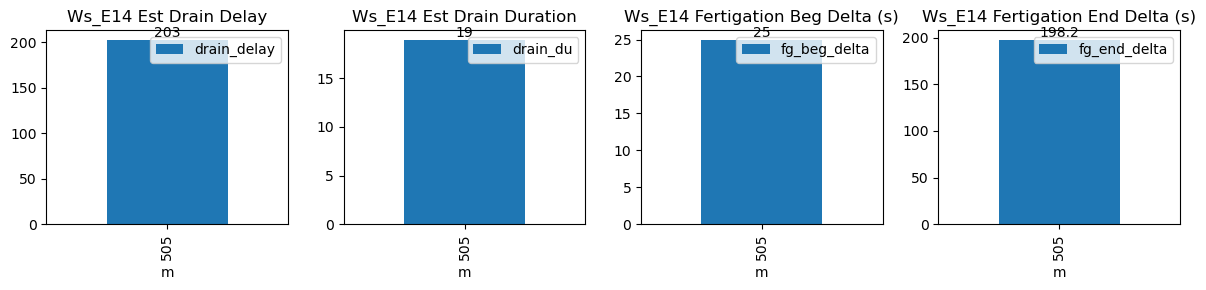
| ds | d | m | ws_name | prominence_cut | max_drain_du | fg_beg | fg_beg_est | fg_end | fg_end_est | ws_beg | ws_end | duc | pre_fg_et | post_fg_ws | post_drn_et | fg_rate_by_dydt | fg_rate_by_dWs | fg_stay_amount | enough_data | fg_beg_delta | fg_end_delta | fg_total_amount | fg_drain_amount | postFg_drain_amount | total_drain_amount | drain_du | drain_delay | drain_rate | field_capacity_est | FVI_1 | FVO_1 |
|---|---|---|---|---|---|---|---|---|---|---|---|---|---|---|---|---|---|---|---|---|---|---|---|---|---|---|---|---|---|---|---|
| 2026-01-26 08:25:00+08:00 | 112 | 505 | Ws_E14 | 0.132791 | 30 | 505.0 | 505.416667 | 505.53 | 508.833333 | 14570.0 | 14663.666667 | 32 | -0.002497 | -0.008205 | -0.004012 | 0.192 | 0.585417 | 18.733333 | True | 25.0 | 198.2 | 18.733333 | 0.0 | 0 | 0.0 | 19 | 203 | -0.00847 | NaN | NaN | NaN |