VI and VO Daily Summary
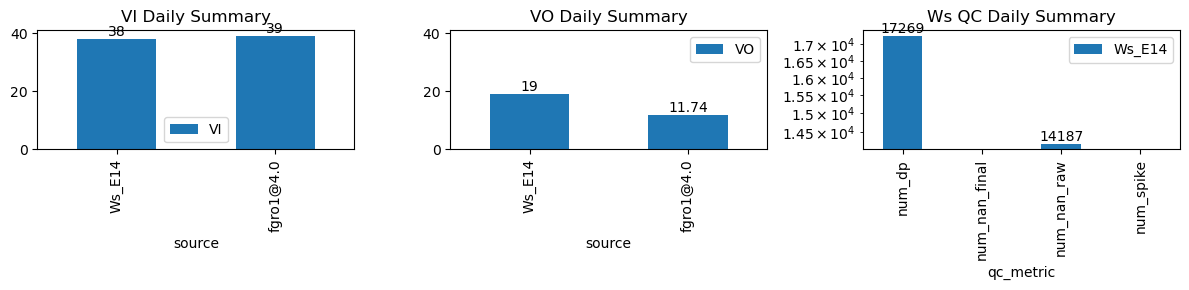
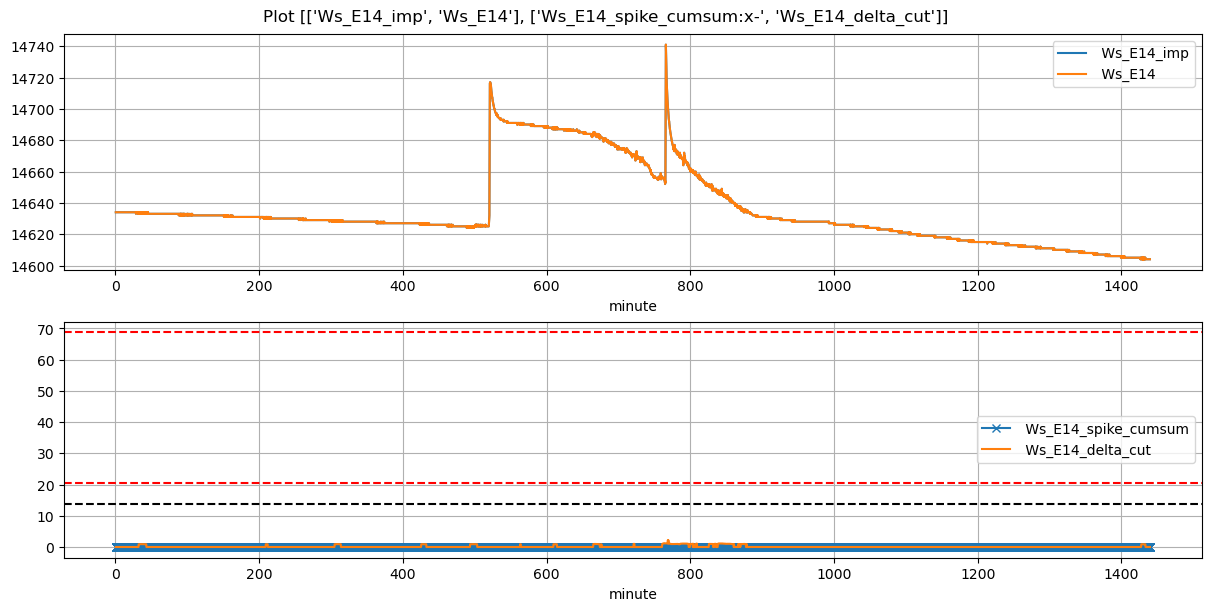
| ws_name | num_dp | num_nan_raw | num_nan_final | num_spike | cum_step_adj |
|---|---|---|---|---|---|
| Ws_E14 | 17,269 | 14,187 | 0 | 0 | 0.00 |
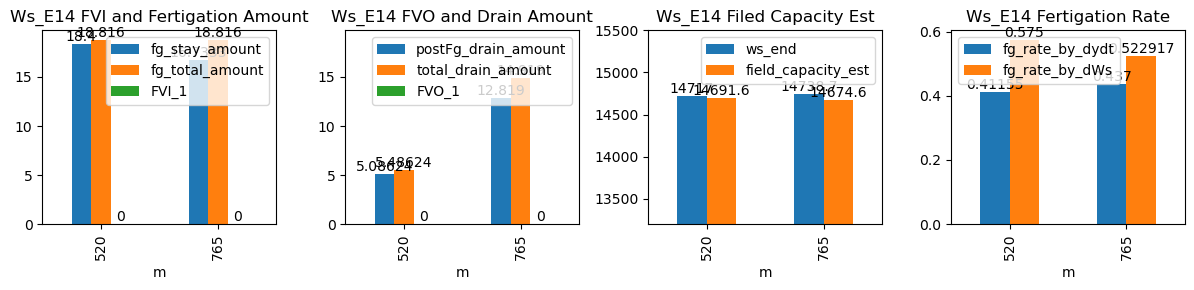
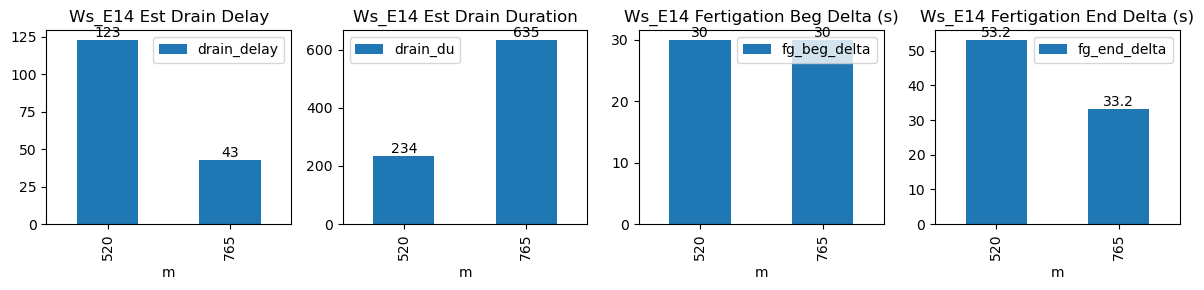
| ds | d | m | ws_name | prominence_cut | max_drain_du | fg_beg | fg_beg_est | fg_end | fg_end_est | ws_beg | ws_end | duc | pre_fg_et | post_fg_ws | post_drn_et | fg_rate_by_dydt | fg_rate_by_dWs | fg_stay_amount | enough_data | fg_beg_delta | fg_end_delta | fg_total_amount | fg_drain_amount | postFg_drain_amount | total_drain_amount | drain_du | drain_delay | drain_rate | field_capacity_est | FVI_1 | FVO_1 |
|---|---|---|---|---|---|---|---|---|---|---|---|---|---|---|---|---|---|---|---|---|---|---|---|---|---|---|---|---|---|---|---|
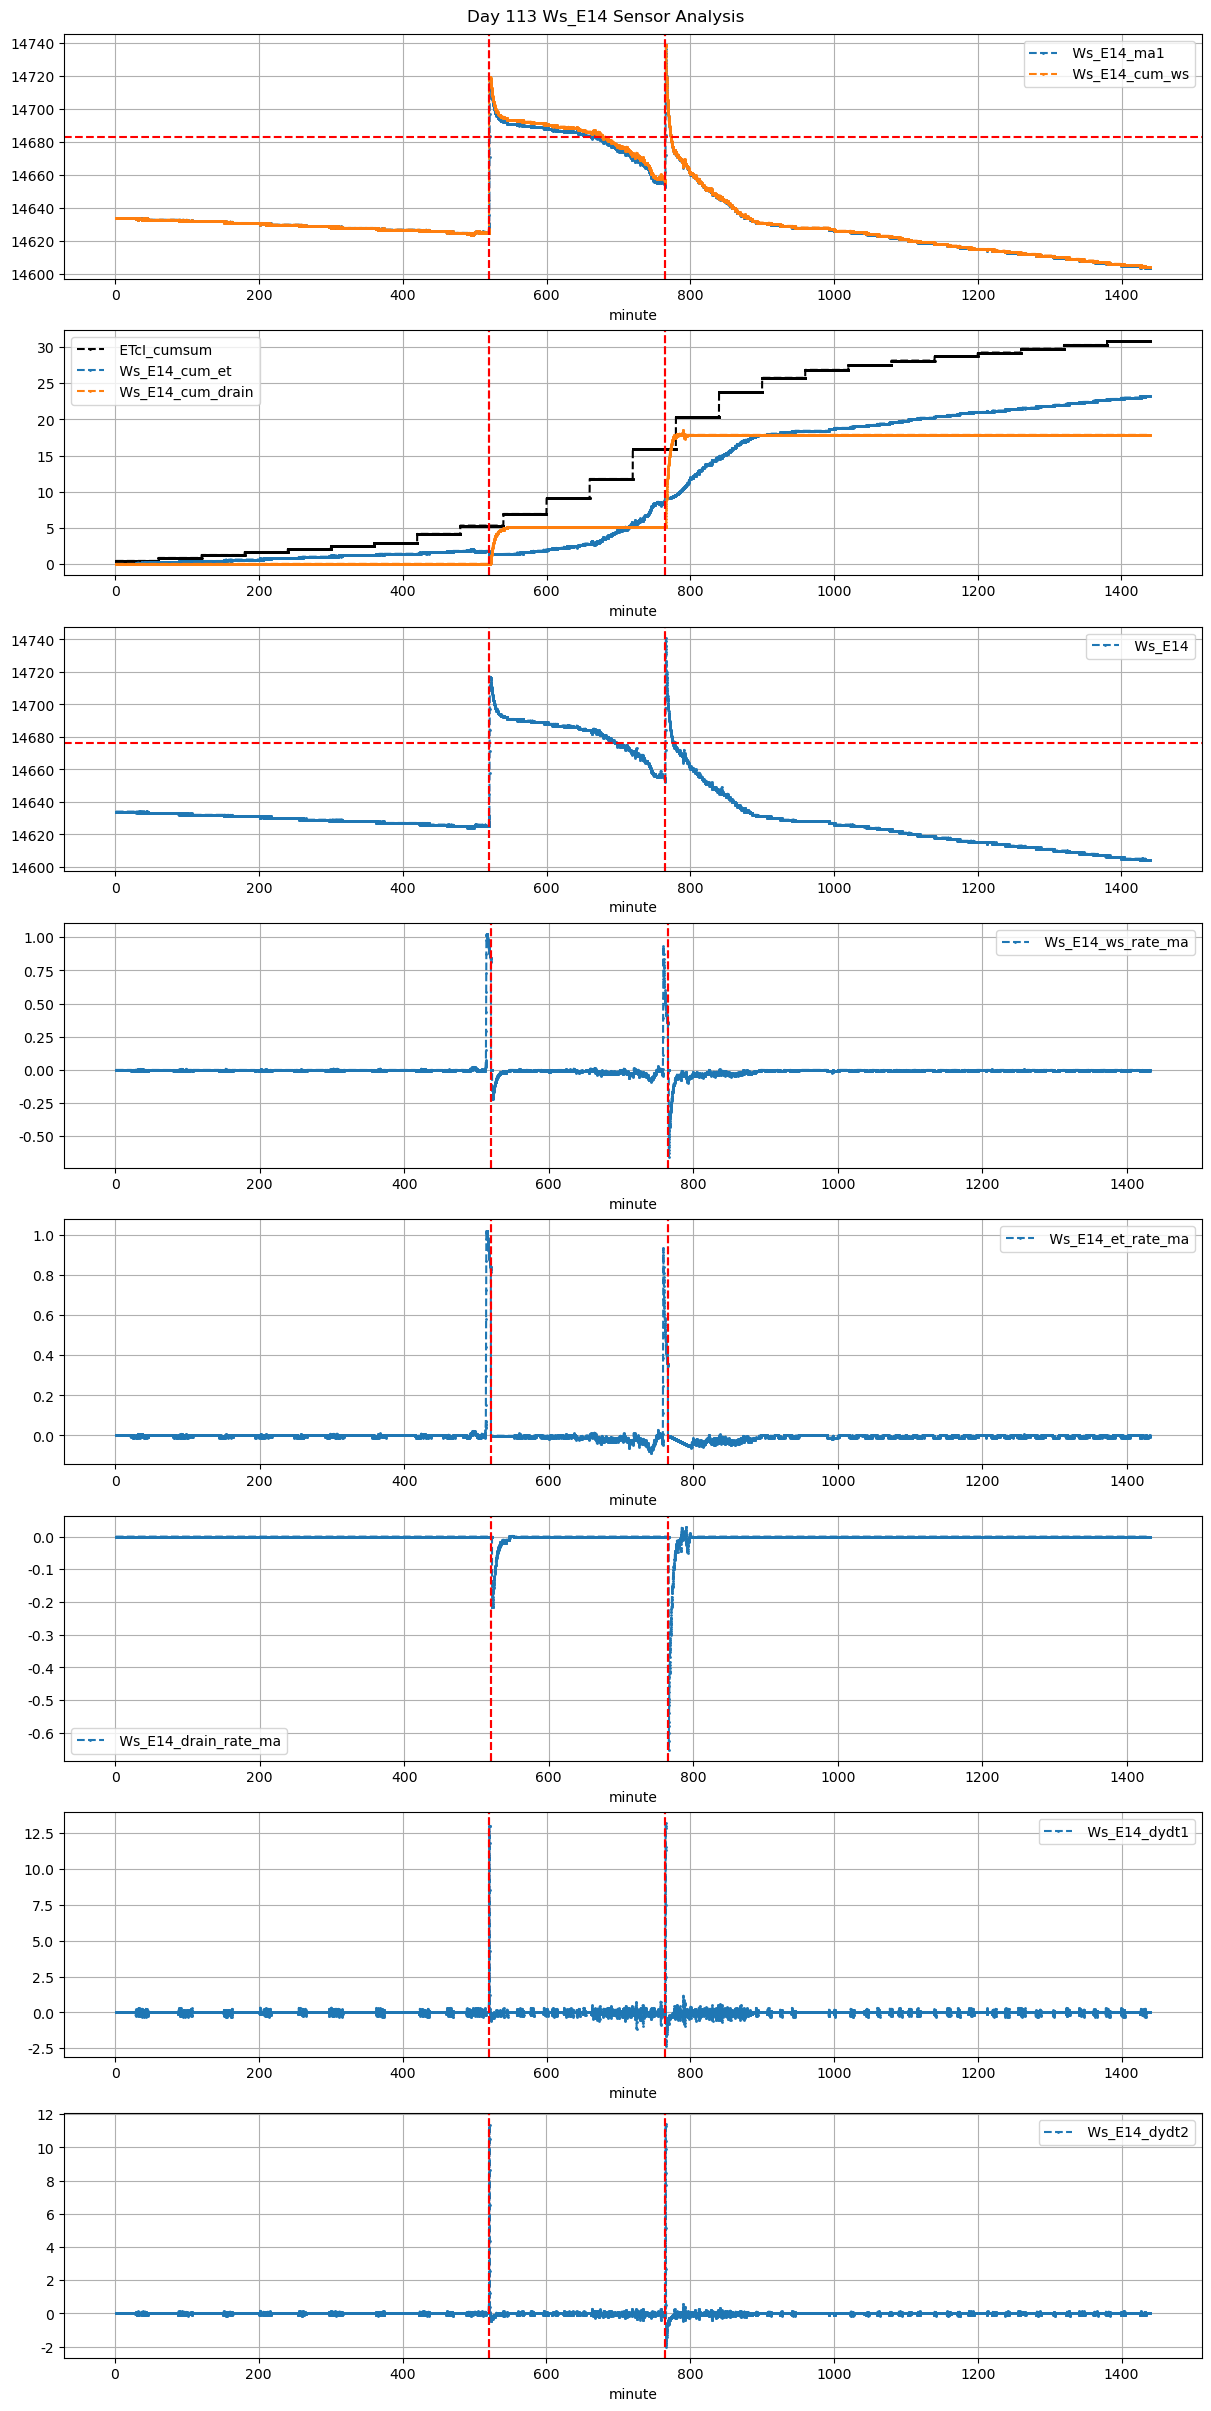
| 2026-01-27 08:40:00+08:00 | 113 | 520 | Ws_E14 | 0.356056 | 30 | 520.0 | 520.5 | 520.53 | 521.416667 | 14625.0 | 14717.0 | 32 | 0.000000 | -0.192326 | 0.000000 | 0.4164 | 0.5750 | 18.4 | True | 30.0 | 53.2 | 18.816 | 0.4 | 5.191667 | 5.591667 | 234 | 123 | -0.363889 | 14691.041667 | NaN | NaN |
| 2026-01-27 12:45:00+08:00 | 113 | 765 | Ws_E14 | 0.356056 | 30 | 765.0 | 765.5 | 765.53 | 766.083333 | 14655.0 | 14741.0 | 32 | -0.008049 | -0.426319 | -0.068889 | 0.4370 | 0.5375 | 17.2 | True | 30.0 | 33.2 | 18.816 | 1.6 | 12.047331 | 13.647331 | 635 | 43 | -1.216610 | 14680.763343 | NaN | NaN |