VI and VO Daily Summary
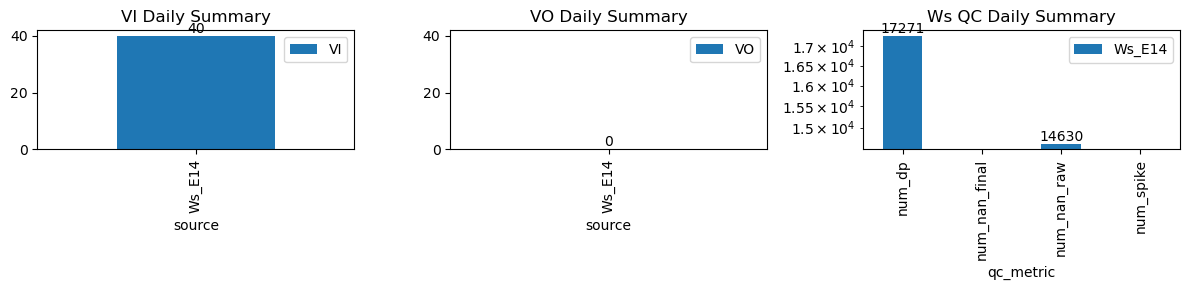
| ws_name | num_dp | num_nan_raw | num_nan_final | num_spike | cum_step_adj |
|---|---|---|---|---|---|
| Ws_E14 | 17,271 | 14,630 | 0 | 0 | 0.00 |
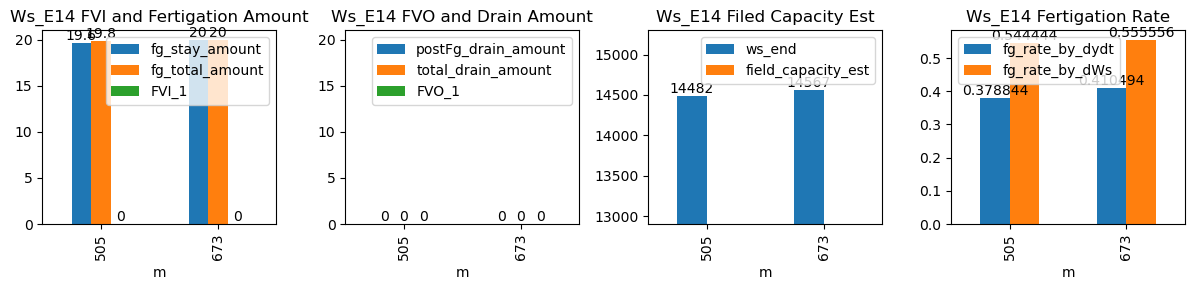
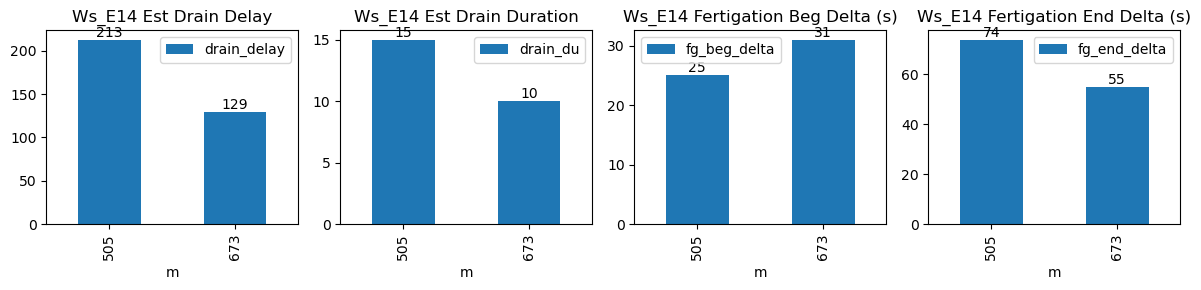
| ds | d | m | ws_name | prominence_cut | max_drain_du | fg_beg | fg_beg_est | fg_end | fg_end_est | ws_beg | ws_end | duc | pre_fg_et | post_fg_ws | post_drn_et | fg_rate_by_dydt | fg_rate_by_dWs | fg_stay_amount | enough_data | fg_beg_delta | fg_end_delta | fg_total_amount | fg_drain_amount | postFg_drain_amount | total_drain_amount | drain_du | drain_delay | drain_rate | field_capacity_est | FVI_1 | FVO_1 |
|---|---|---|---|---|---|---|---|---|---|---|---|---|---|---|---|---|---|---|---|---|---|---|---|---|---|---|---|---|---|---|---|
| 2026-01-17 08:25:00+08:00 | 103 | 505 | Ws_E14 | 0.13913 | 30 | 505.0 | 505.416667 | 505.6 | 506.833333 | 14384.0 | 14482.0 | 36 | -0.001130 | -0.006369 | -0.000139 | 0.378844 | 0.544444 | 19.6 | True | 25.0 | 74.0 | 19.8 | 0.0 | 0 | 0.0 | 15 | 213 | -0.293458 | NaN | NaN | NaN |
| 2026-01-17 11:13:24+08:00 | 103 | 673 | Ws_E14 | 0.13913 | 30 | 673.4 | 673.916667 | 674.0 | 674.916667 | 14467.0 | 14567.0 | 36 | -0.008182 | -0.021394 | -0.012222 | 0.410494 | 0.555556 | 20.0 | True | 31.0 | 55.0 | 20.0 | 0.0 | 0 | 0.0 | 10 | 129 | -0.238842 | NaN | NaN | NaN |