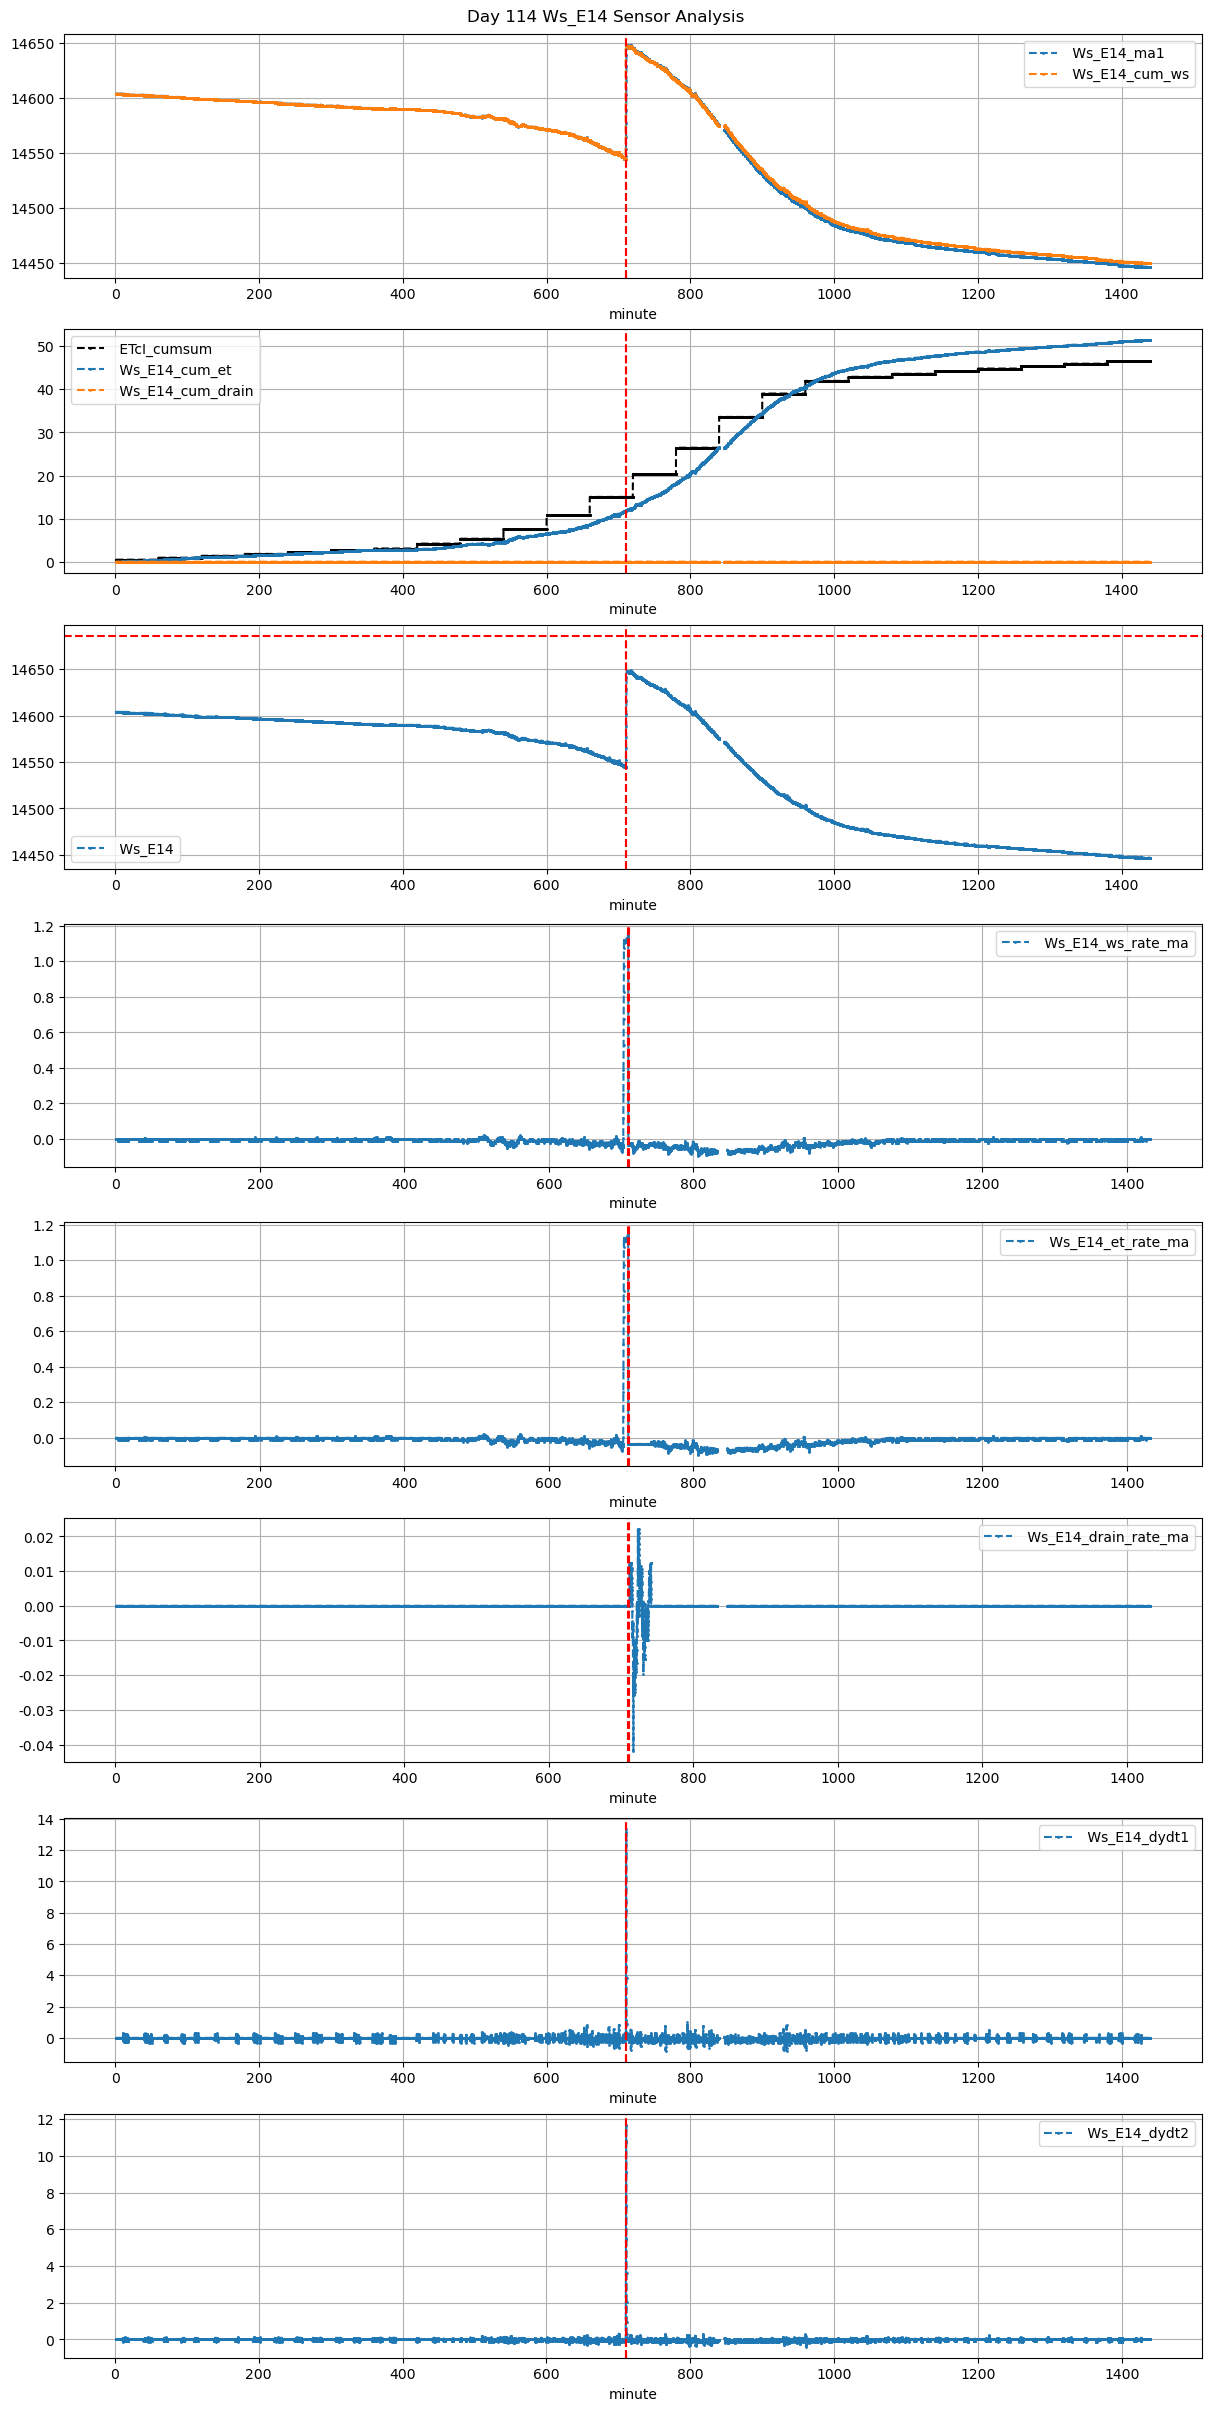
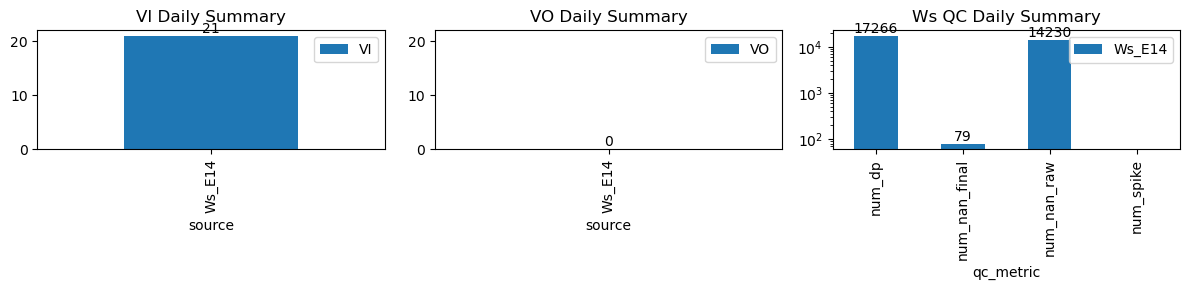
VI and VO Daily Summary
| ws_name | num_dp | num_nan_raw | num_nan_final | num_spike | cum_step_adj |
|---|---|---|---|---|---|
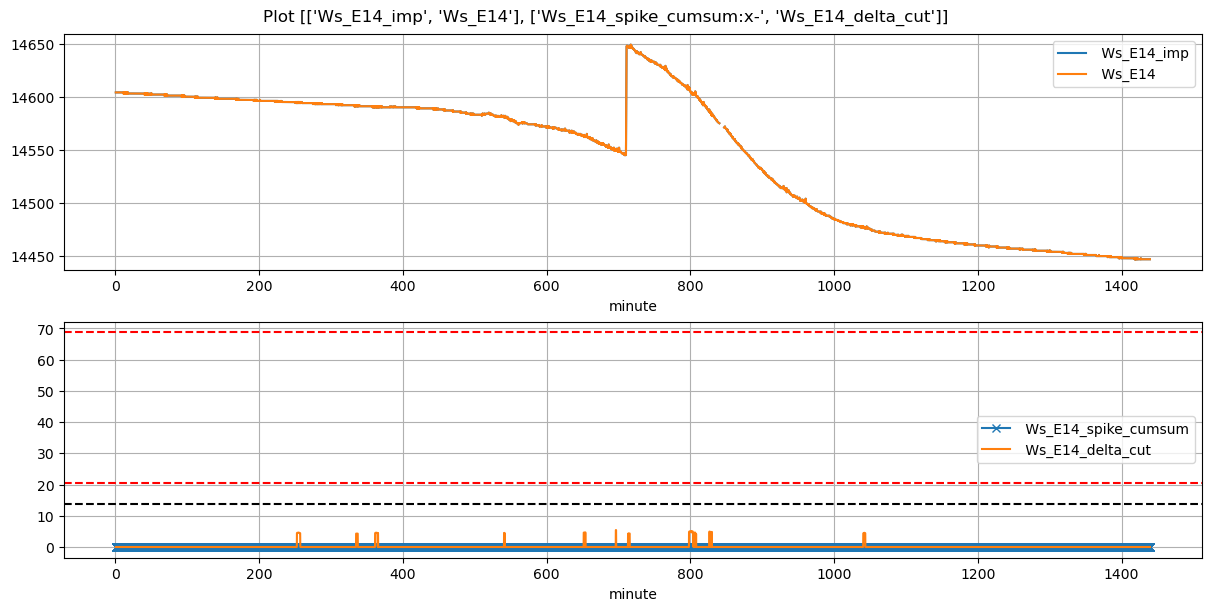
| Ws_E14 | 17,266 | 14,230 | 79 | 0 | 0.00 |
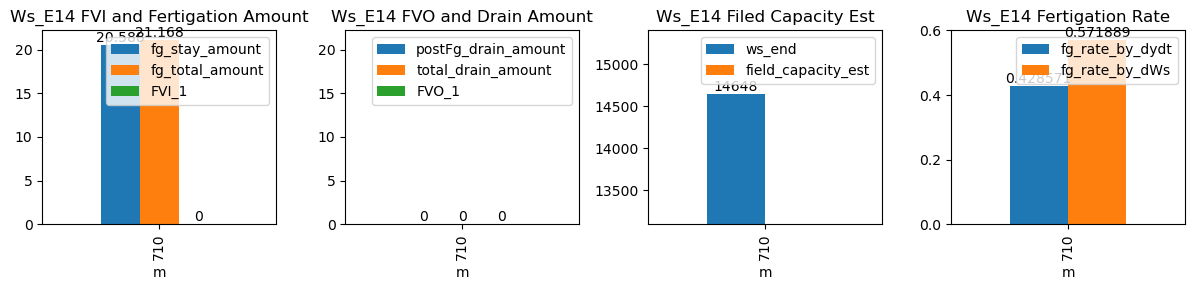
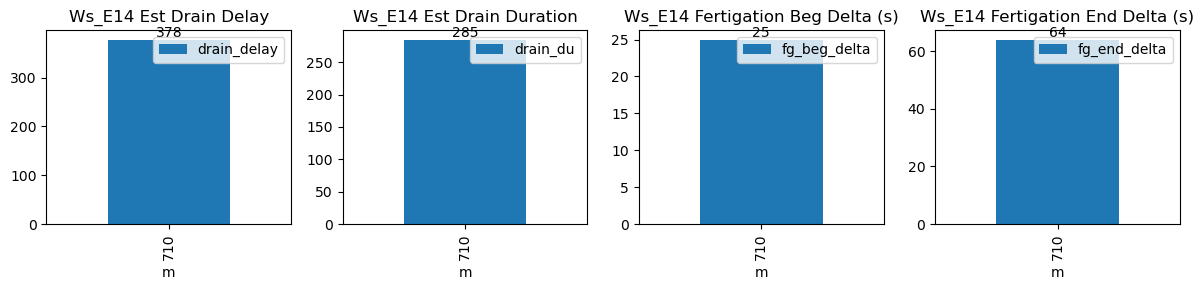
| ds | d | m | ws_name | prominence_cut | max_drain_du | fg_beg | fg_beg_est | fg_end | fg_end_est | ws_beg | ws_end | duc | pre_fg_et | post_fg_ws | post_drn_et | fg_rate_by_dydt | fg_rate_by_dWs | fg_stay_amount | enough_data | fg_beg_delta | fg_end_delta | fg_total_amount | fg_drain_amount | postFg_drain_amount | total_drain_amount | drain_du | drain_delay | drain_rate | field_capacity_est | FVI_1 | FVO_1 |
|---|---|---|---|---|---|---|---|---|---|---|---|---|---|---|---|---|---|---|---|---|---|---|---|---|---|---|---|---|---|---|---|
| 2026-01-28 11:50:00+08:00 | 114 | 710 | Ws_E14 | 0.208624 | 30 | 710.0 | 710.416667 | 710.6 | 711.583333 | 14545.0 | 14648.0 | 36 | -0.042615 | -0.016435 | -0.034694 | 0.429143 | 0.572222 | 20.6 | True | 25.0 | 59.0 | 21.168 | 0.0 | 0 | 0.0 | 30 | 389 | -0.287356 | NaN | NaN | NaN |