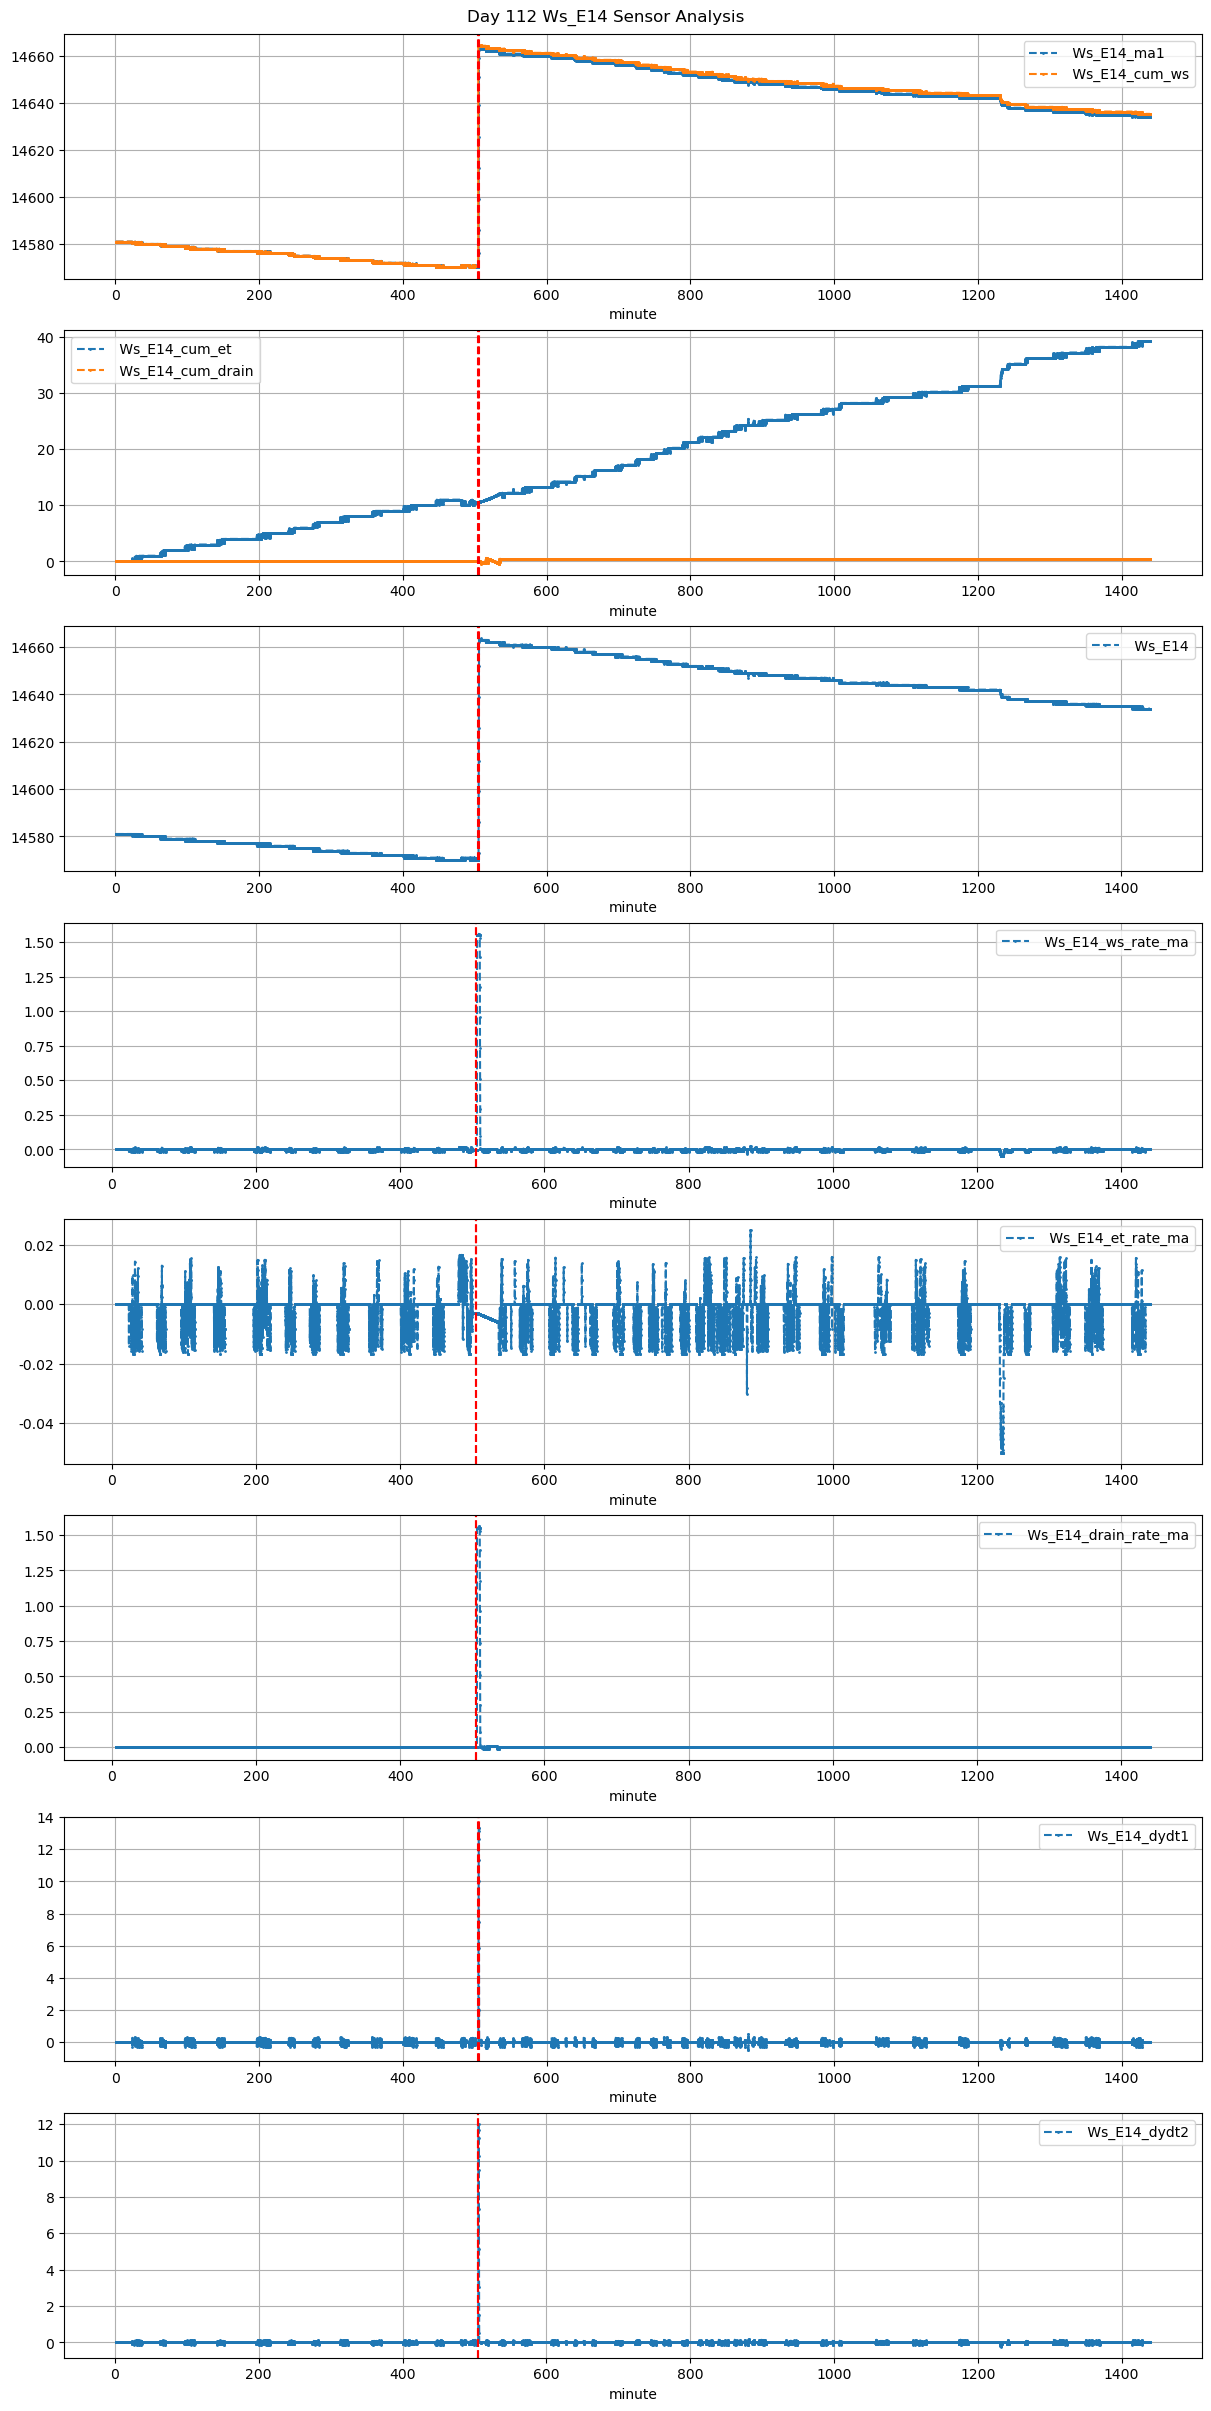
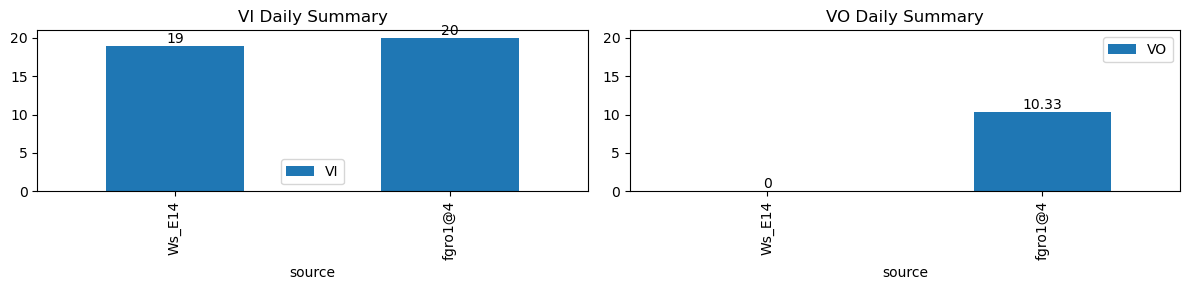
VI and VO Daily Summary
| ws_name | total_dp | nan_dp | nan_filled_dp | long_gap_dp | num_spike |
|---|---|---|---|---|---|
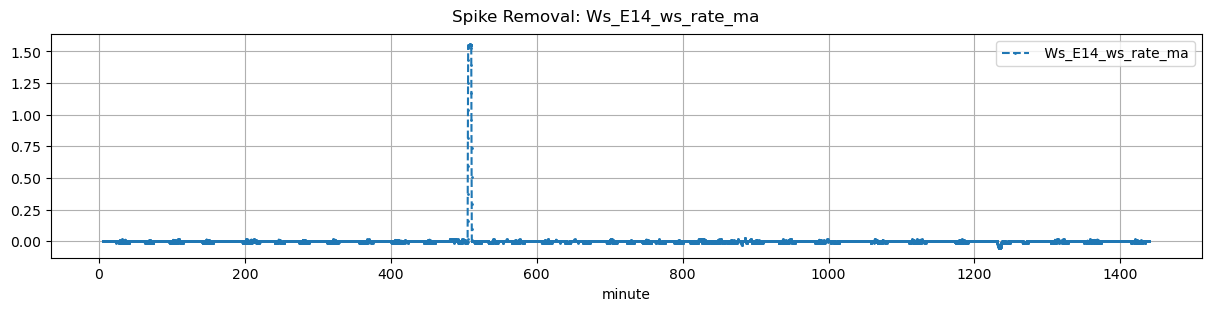
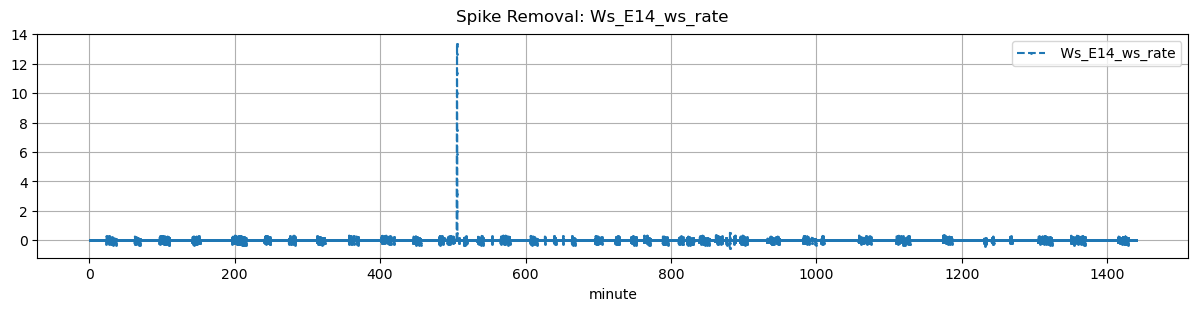
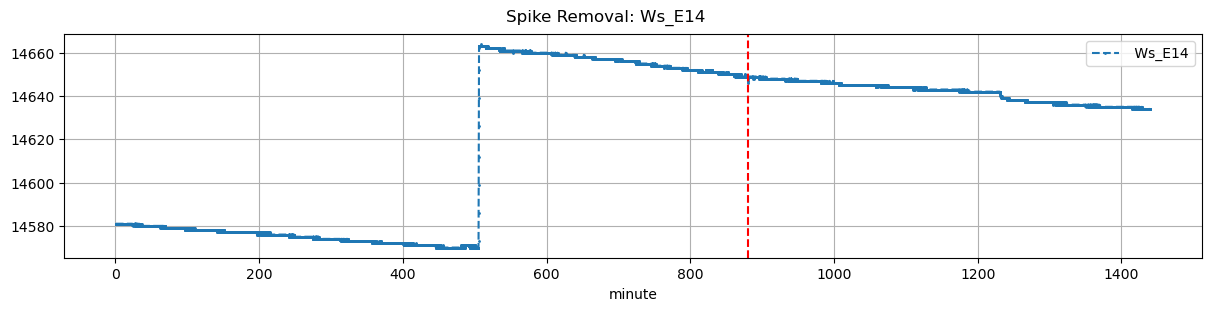
| Ws_E14 | 17269 | 0 | 14684 | 0 | 1 |
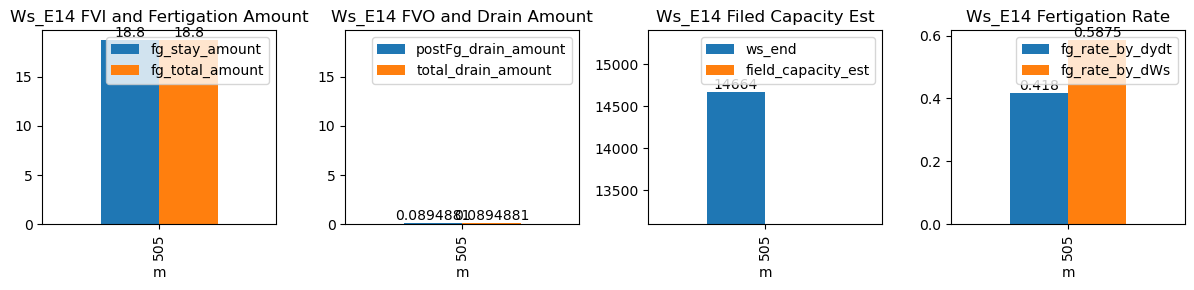
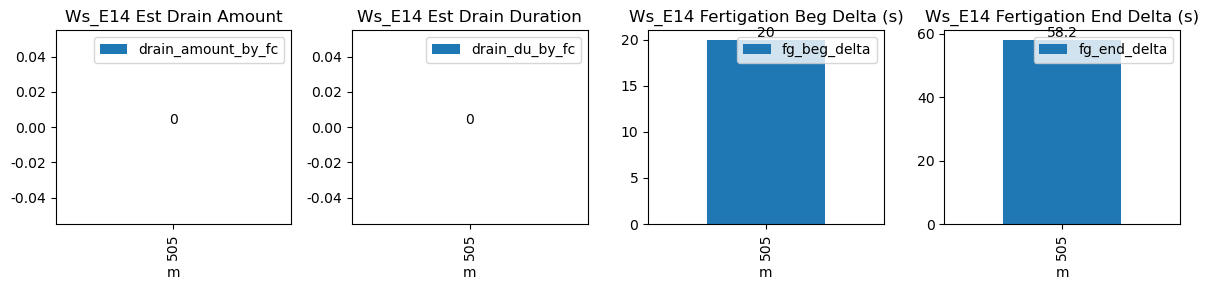
| ds | d | m | ws_name | prominence_cut | max_drain_du | fg_beg | fg_beg_est | fg_end | fg_end_est | drain_amount_by_fc | drain_du_by_fc | drain_rate_by_fc | ws_beg | ws_end | duc | pre_fg_et | post_fg_ws | post_drn_et | fg_rate_by_dydt | fg_rate_by_dWs | fg_stay_amount | fg_beg_delta | fg_end_delta | fg_total_amount | fg_drain_amount | postFg_drain_amount | field_capacity_est | total_drain_amount |
|---|---|---|---|---|---|---|---|---|---|---|---|---|---|---|---|---|---|---|---|---|---|---|---|---|---|---|---|---|
| 2026-01-26 08:25:00+08:00 | 112 | 505 | Ws_E14 | 0.131534 | 30 | 505.0 | 505.333333 | 505.53 | 506.5 | NaN | NaN | NaN | 14570.0 | 14664.0 | 32 | -0.006073 | -0.002917 | -0.006042 | 0.418 | 0.5875 | 18.8 | 20.0 | 58.2 | 18.8 | 0.0 | 0.089488 | NaN | 0.089488 |