| 2026-01-25 08:03:15+08:00 |
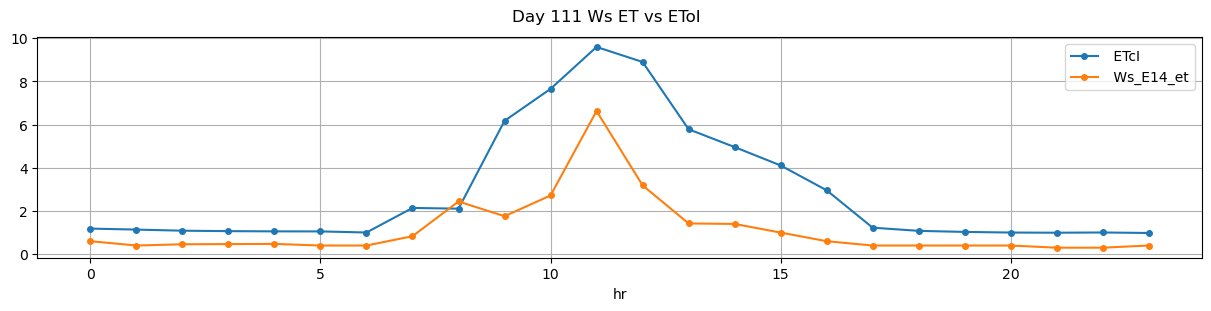
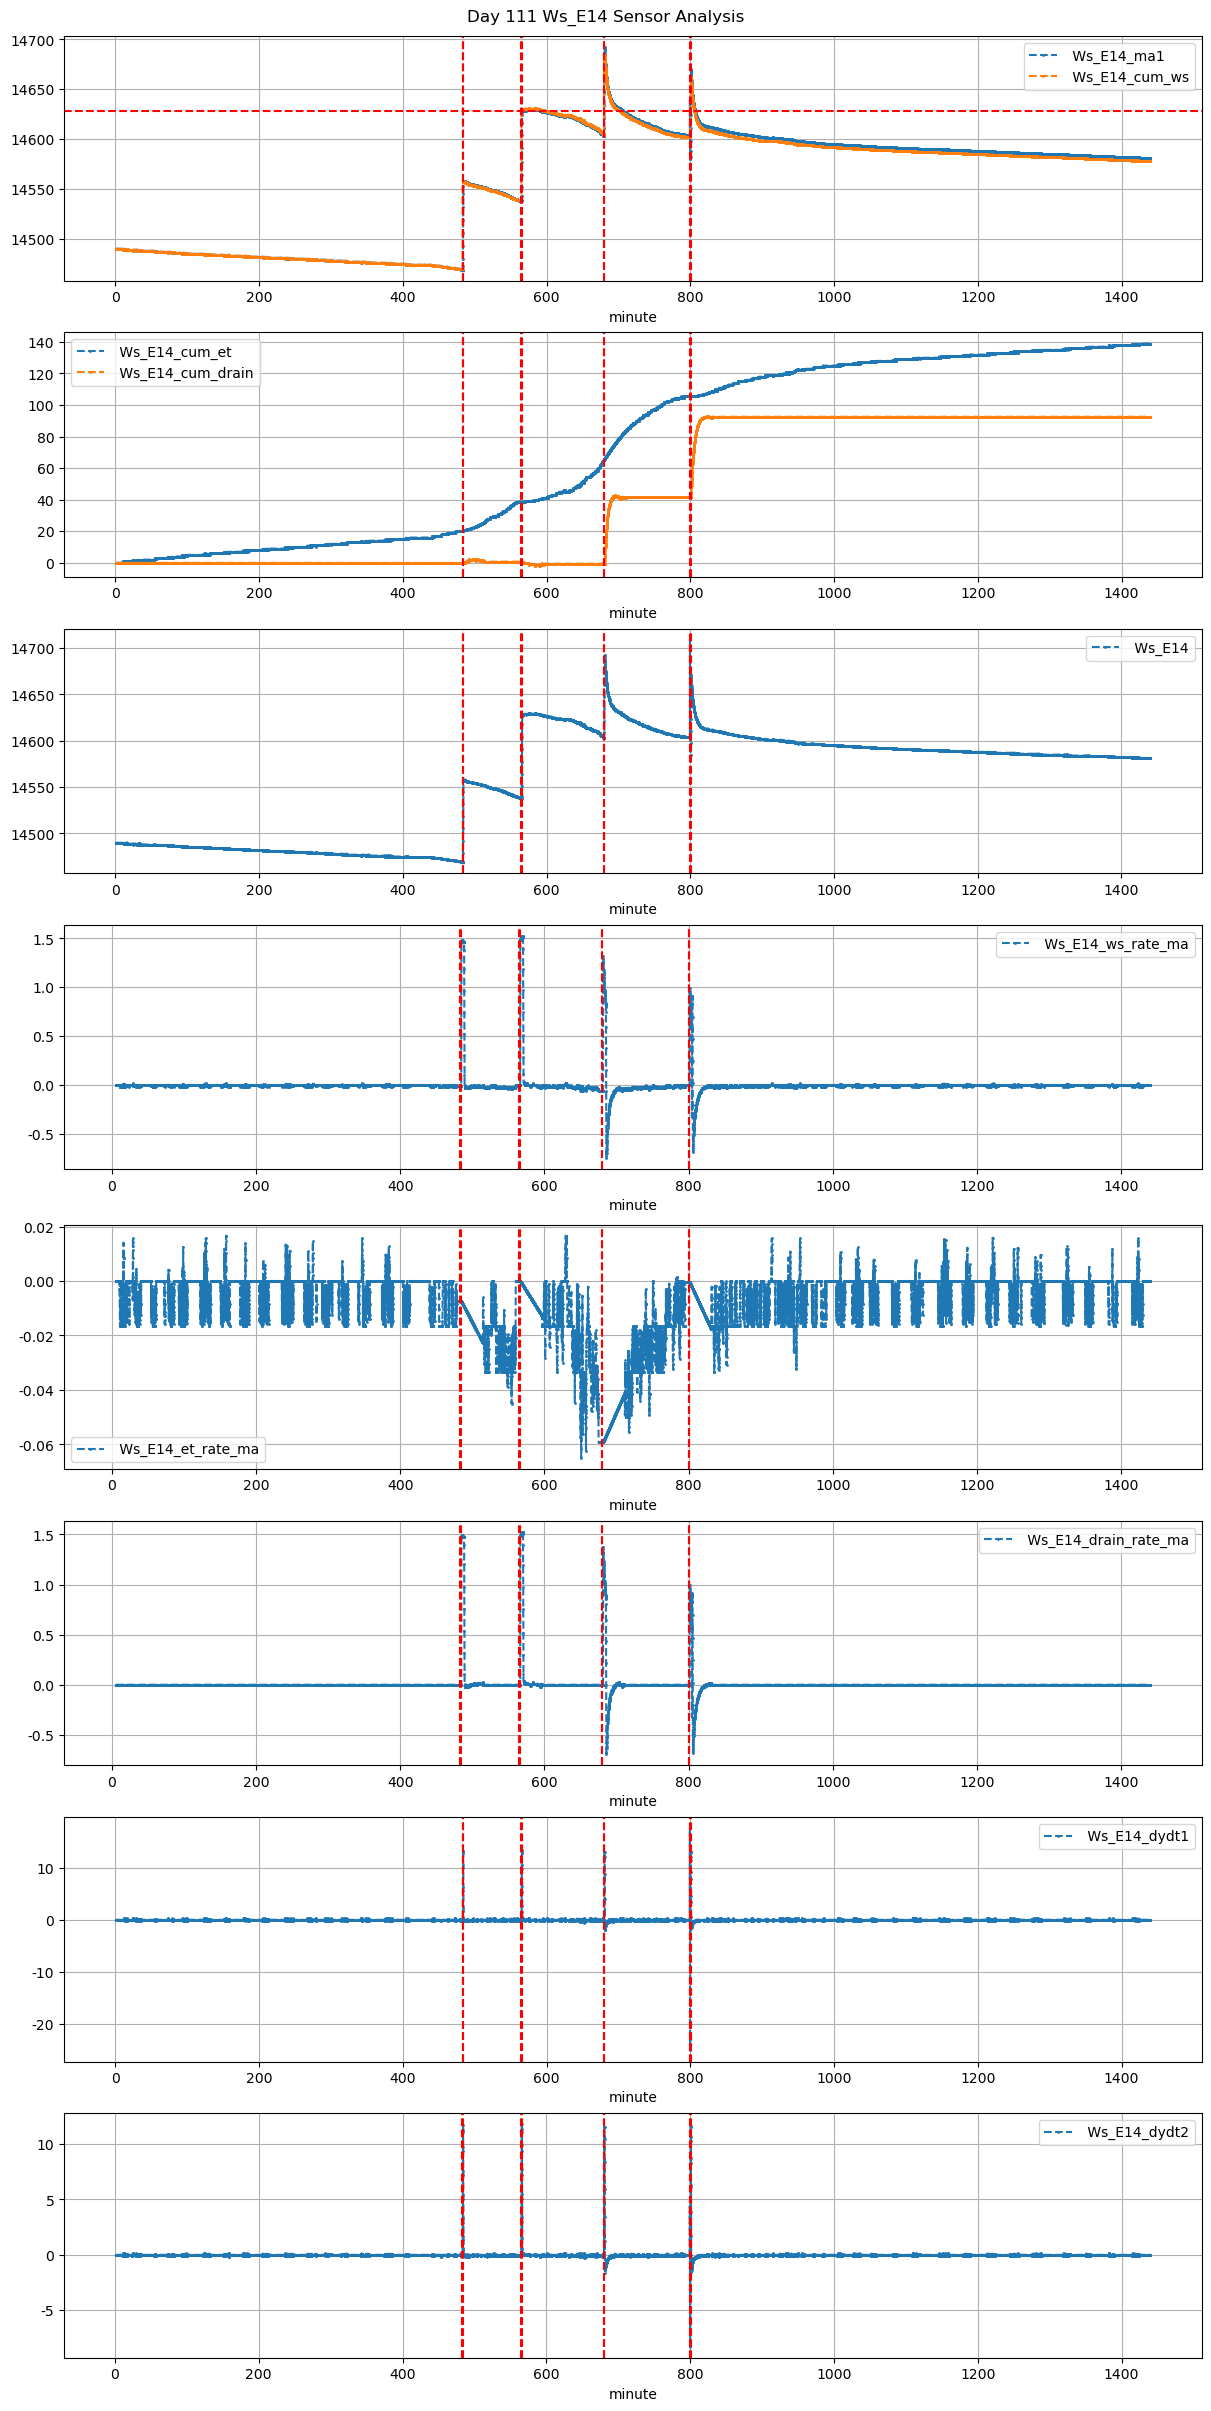
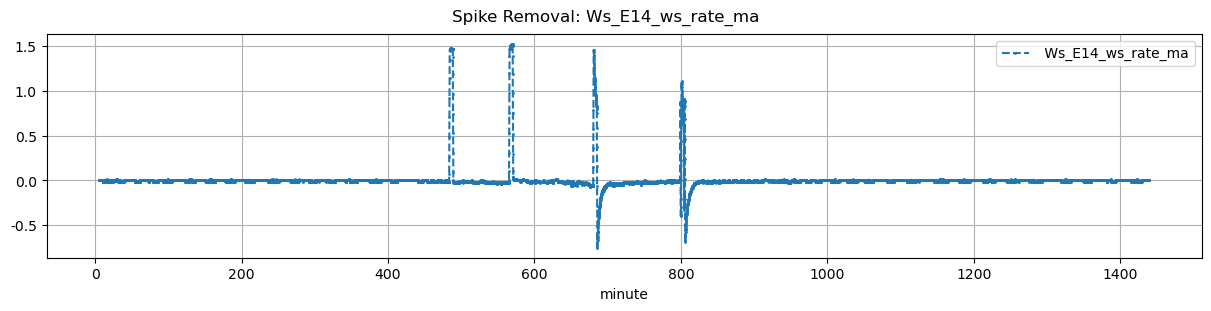
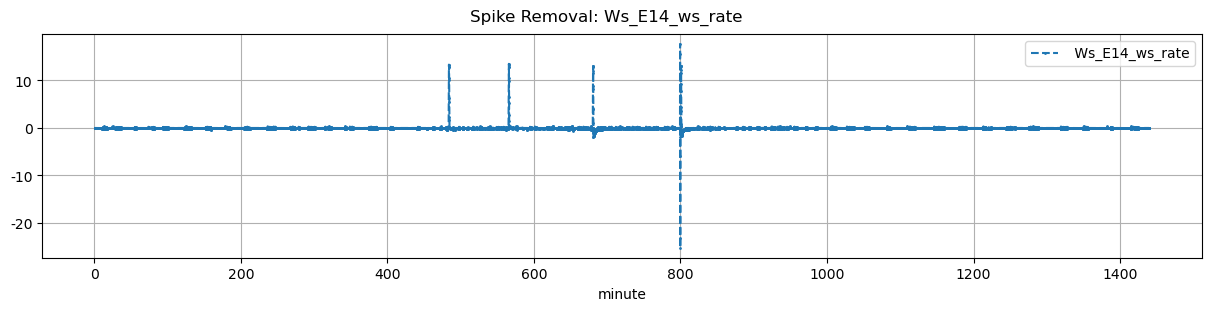
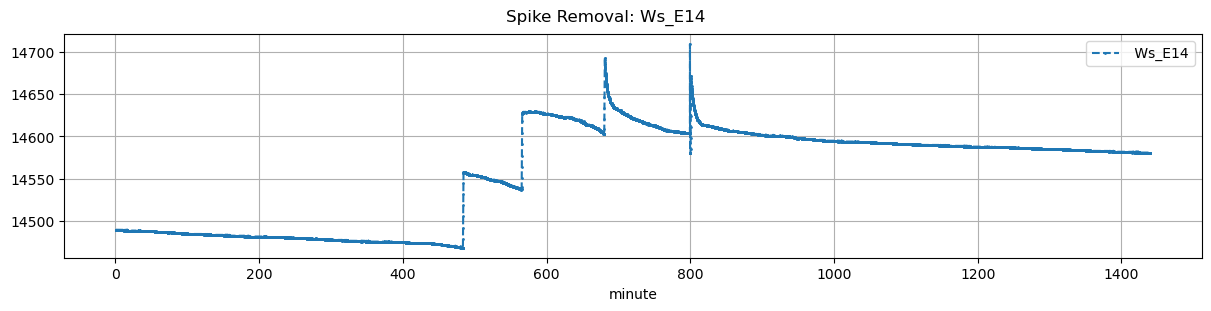
111 |
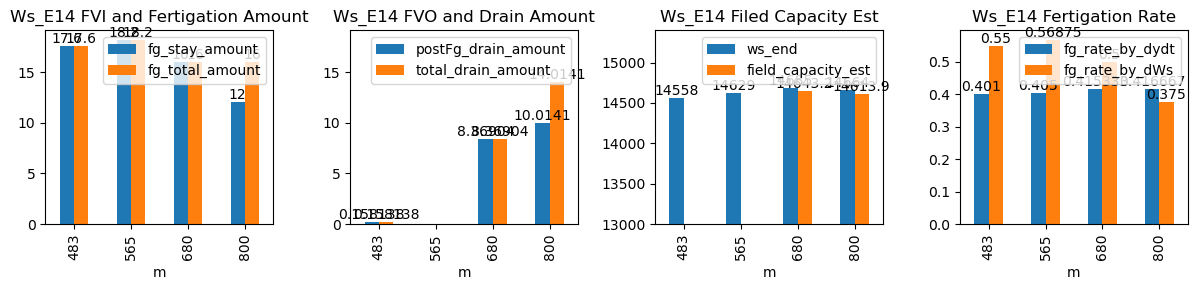
483 |
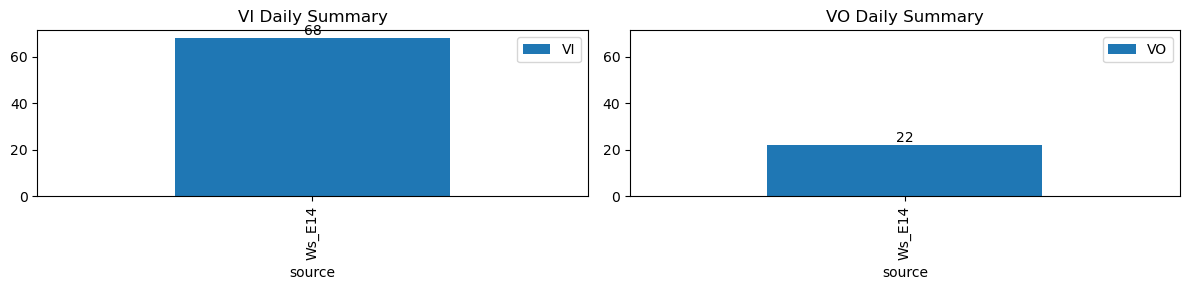
Ws_E14 |
0.713116 |
30 |
483.25 |
483.583333 |
483.78 |
484.750000 |
NaN |
NaN |
NaN |
14470.0 |
14558.0 |
32 |
-0.007415 |
-0.032083 |
-0.022778 |
0.401000 |
0.55000 |
17.6 |
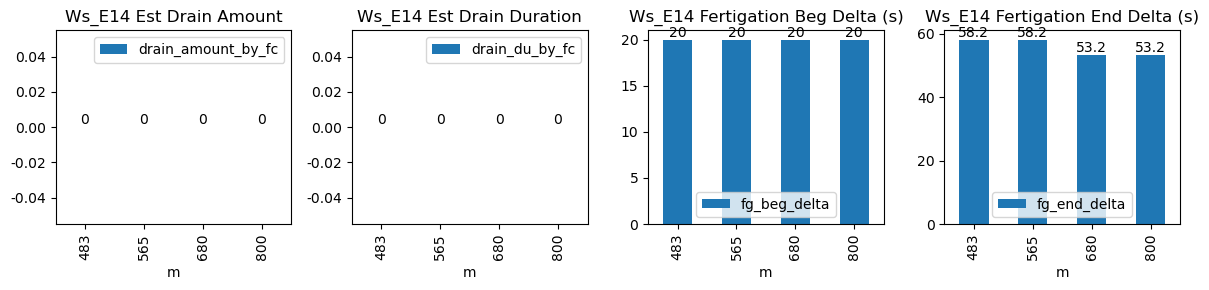
20.0 |
58.2 |
17.6 |
0.000000e+00 |
0.158138 |
NaN |
0.158138 |
| 2026-01-25 09:25:00+08:00 |
111 |
565 |
Ws_E14 |
0.713116 |
30 |
565.00 |
565.333333 |
565.53 |
566.500000 |
NaN |
NaN |
NaN |
14538.0 |
14629.0 |
32 |
-0.020480 |
0.000000 |
-0.012778 |
0.405000 |
0.56875 |
18.2 |
20.0 |
58.2 |
18.2 |
0.000000e+00 |
-0.273723 |
NaN |
-0.273723 |
| 2026-01-25 11:20:00+08:00 |
111 |
680 |
Ws_E14 |
0.713116 |
30 |
680.00 |
680.333333 |
680.53 |
681.416667 |
NaN |
NaN |
NaN |
14605.0 |
14685.0 |
32 |
-0.059204 |
-0.339583 |
-0.041019 |
0.415333 |
0.50000 |
16.0 |
20.0 |
53.2 |
16.0 |
3.641532e-13 |
8.369042 |
14643.154791 |
8.369042 |
| 2026-01-25 13:20:00+08:00 |
111 |
800 |
Ws_E14 |
0.713116 |
30 |
800.00 |
800.333333 |
800.53 |
801.416667 |
NaN |
NaN |
NaN |
14604.0 |
14664.0 |
32 |
-0.000444 |
-0.325556 |
-0.017788 |
0.416667 |
0.37500 |
12.0 |
20.0 |
53.2 |
16.0 |
4.000000e+00 |
10.014110 |
14613.929448 |
14.014110 |