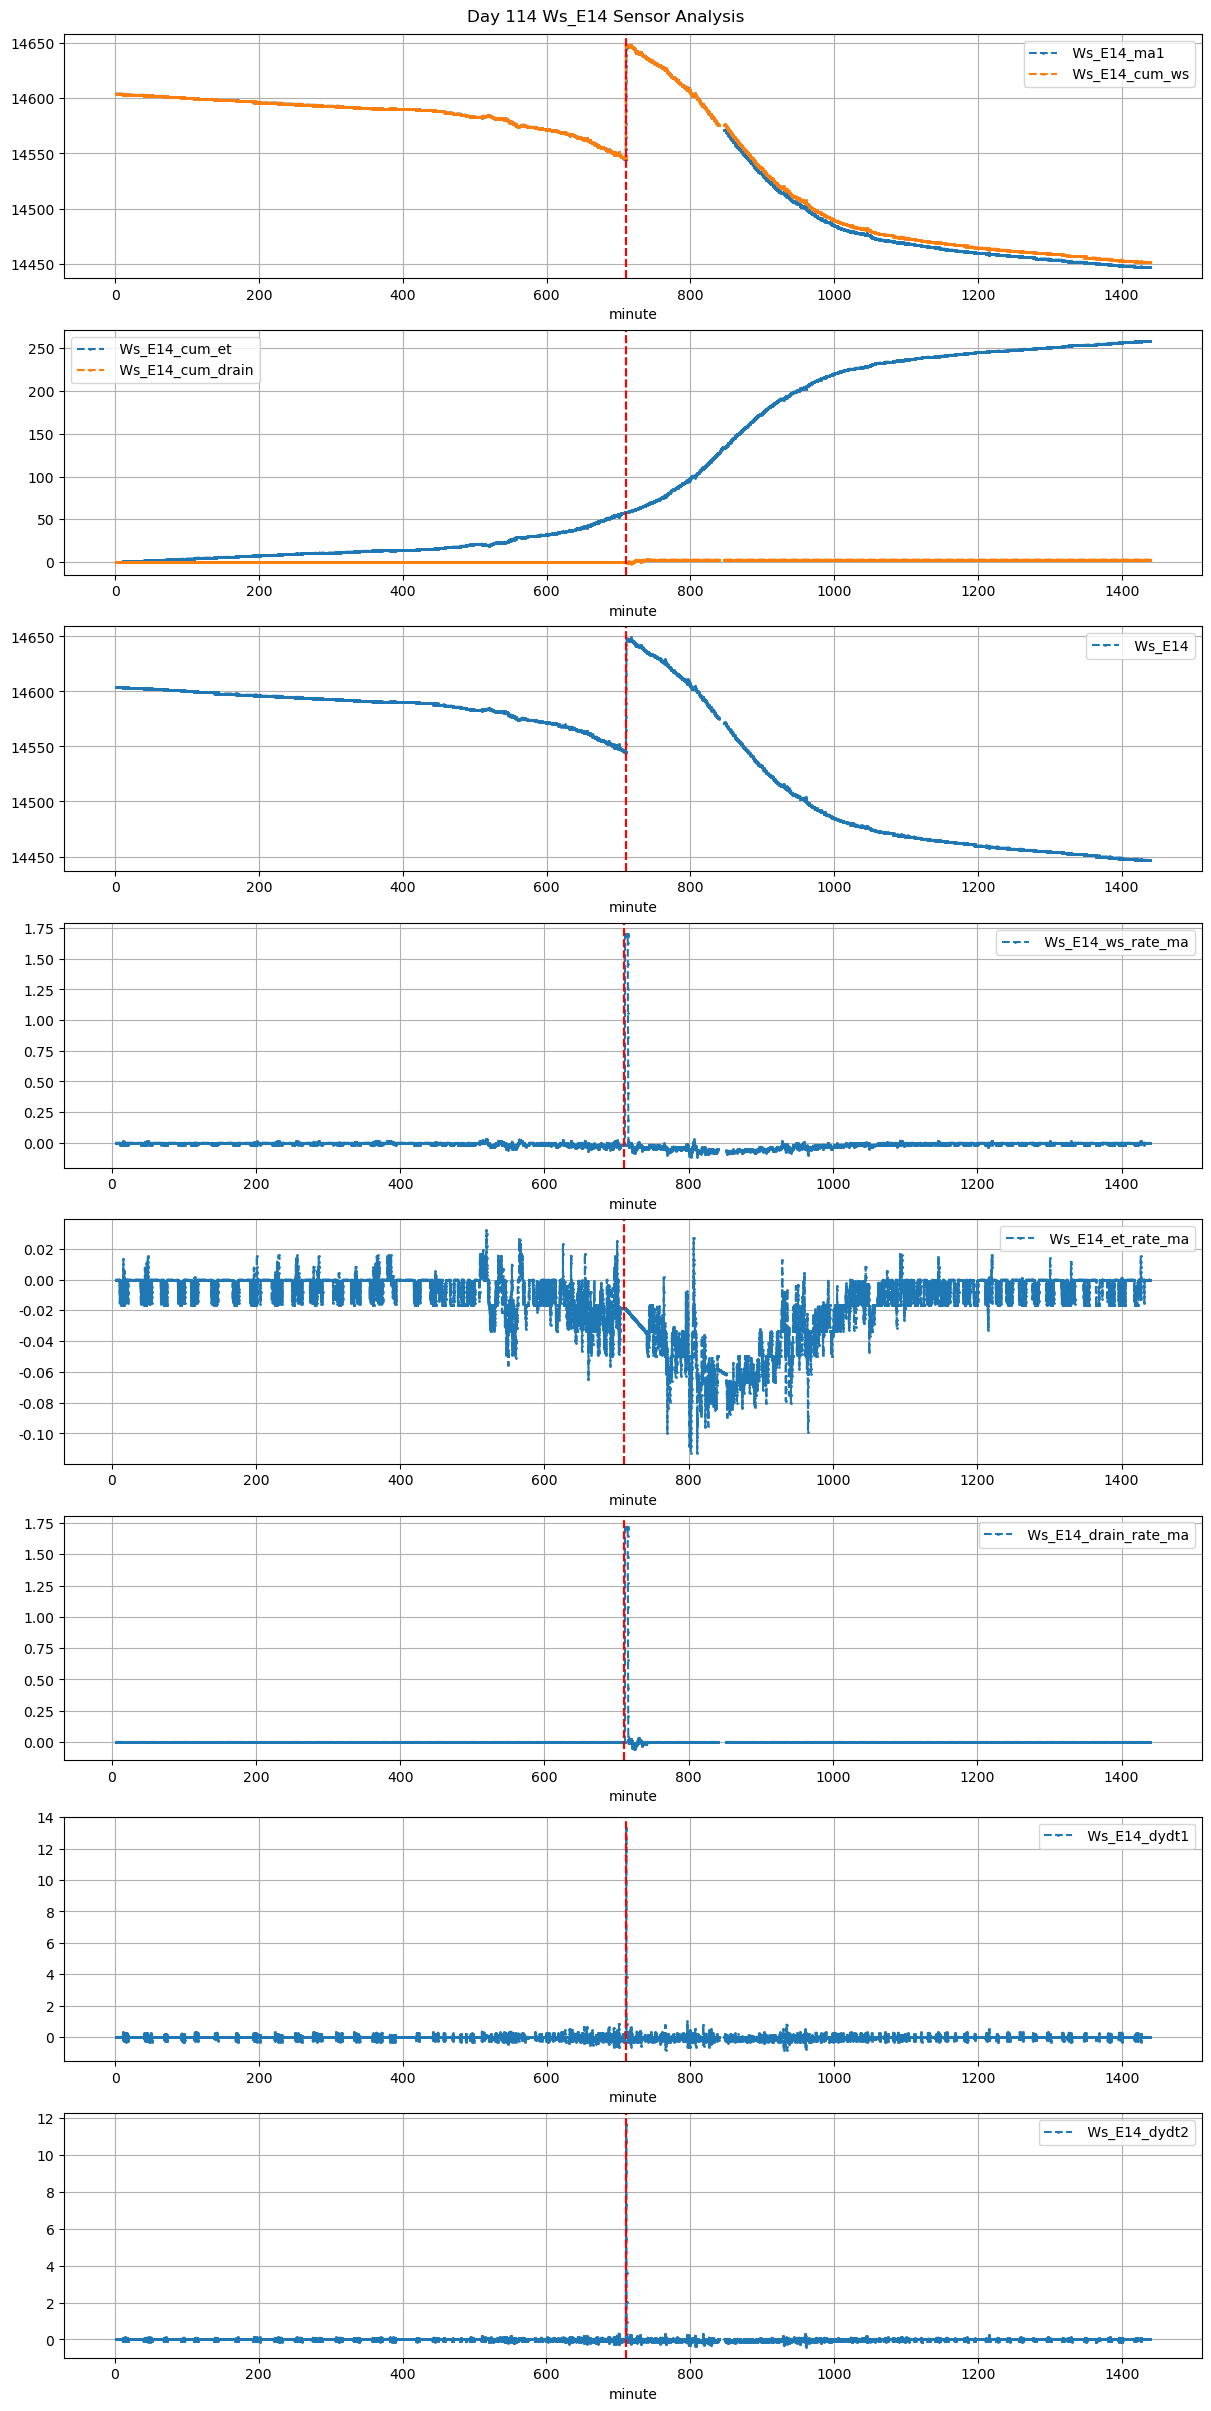
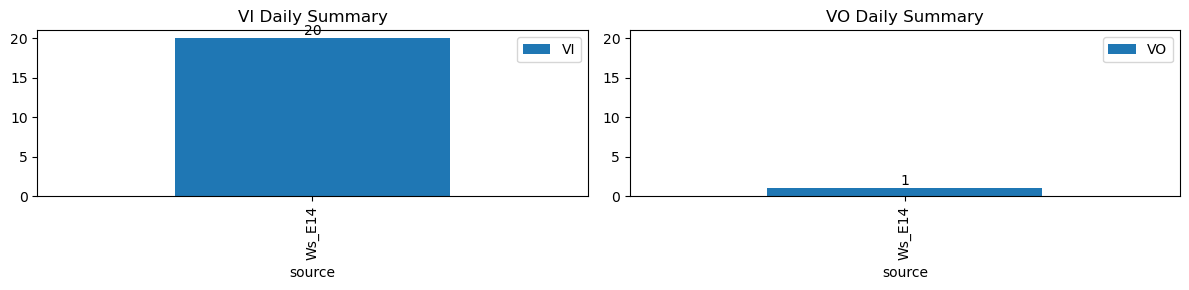
VI and VO Daily Summary
| ws_name | total_dp | nan_dp | nan_filled_dp | long_gap_dp | num_spike |
|---|---|---|---|---|---|
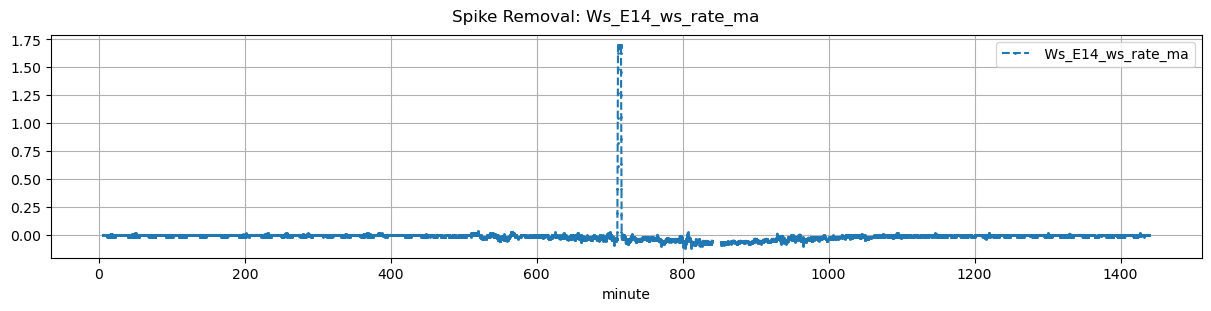
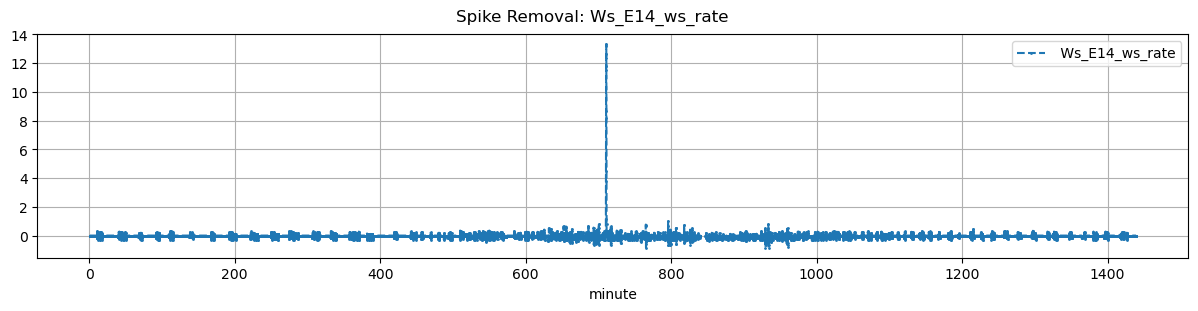
| Ws_E14 | 17266 | 79 | 14151 | 79 | 1 |
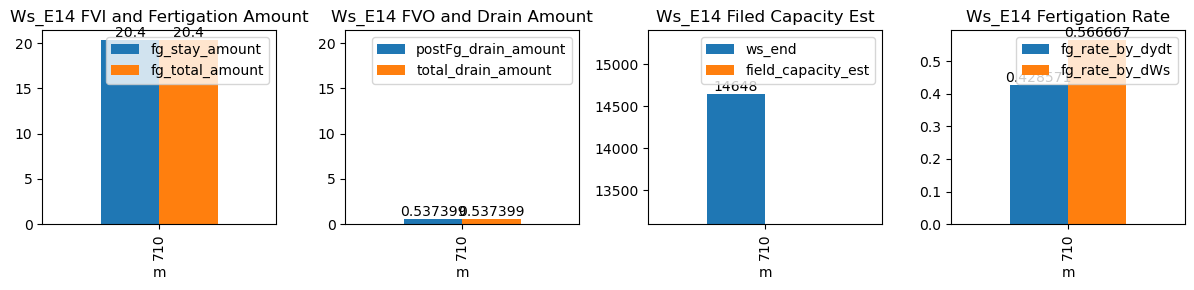
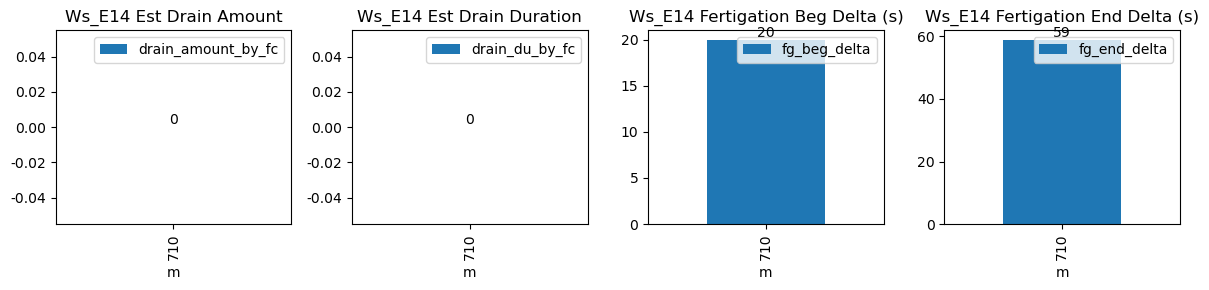
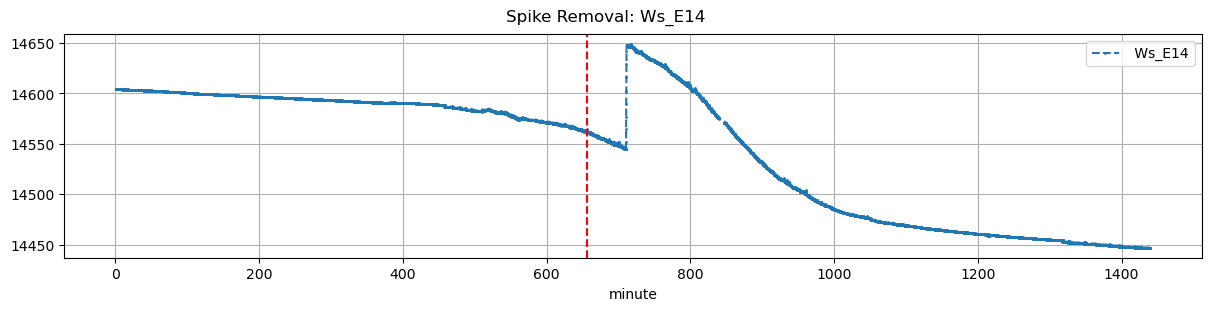
| ds | d | m | ws_name | prominence_cut | max_drain_du | fg_beg | fg_beg_est | fg_end | fg_end_est | drain_amount_by_fc | drain_du_by_fc | drain_rate_by_fc | ws_beg | ws_end | duc | pre_fg_et | post_fg_ws | post_drn_et | fg_rate_by_dydt | fg_rate_by_dWs | fg_stay_amount | fg_beg_delta | fg_end_delta | fg_total_amount | fg_drain_amount | postFg_drain_amount | field_capacity_est | total_drain_amount |
|---|---|---|---|---|---|---|---|---|---|---|---|---|---|---|---|---|---|---|---|---|---|---|---|---|---|---|---|---|
| 2026-01-28 11:50:00+08:00 | 114 | 710 | Ws_E14 | 0.208987 | 30 | 710.0 | 710.333333 | 710.6 | 711.583333 | NaN | NaN | NaN | 14546.0 | 14648.0 | 36 | -0.04092 | -0.018611 | -0.034694 | 0.428571 | 0.566667 | 20.4 | 20.0 | 59.0 | 20.4 | 0.0 | 0.537399 | NaN | 0.537399 |