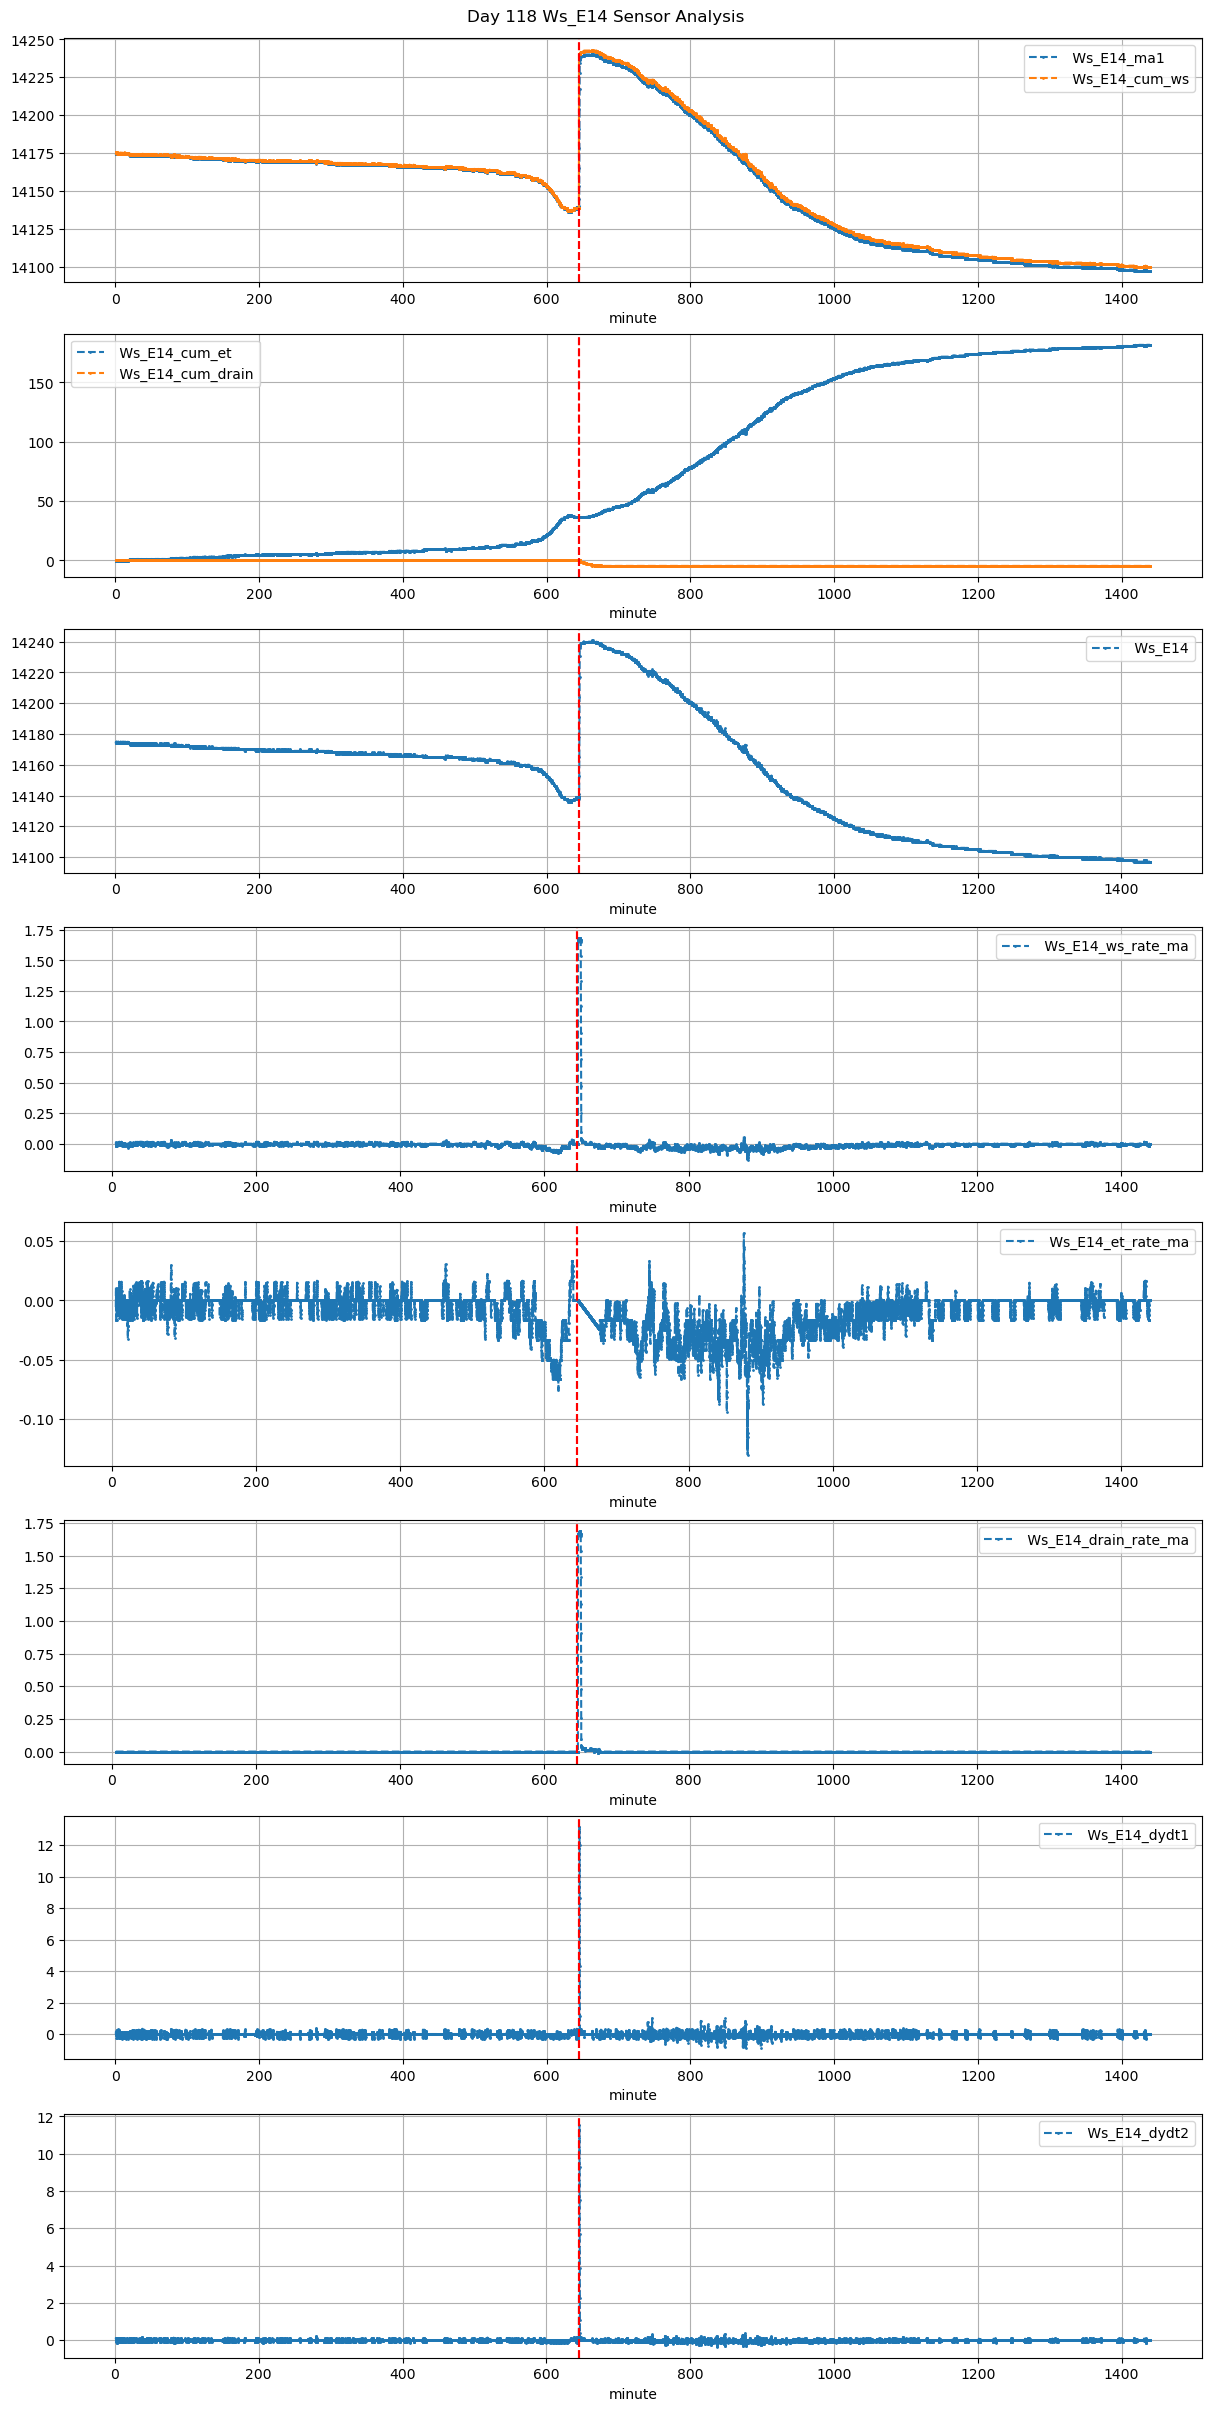
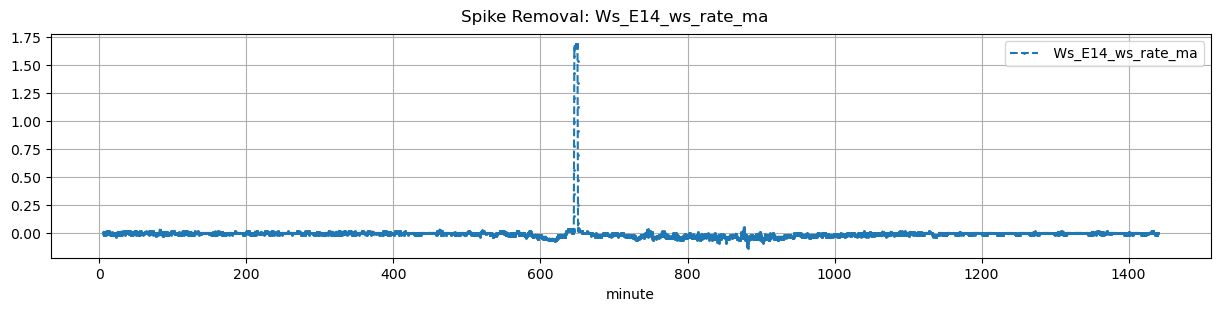
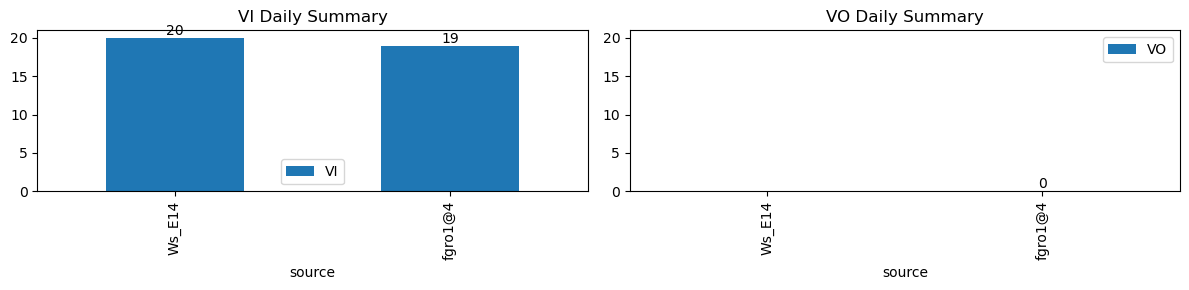
VI and VO Daily Summary
| ws_name | total_dp | nan_dp | nan_filled_dp | long_gap_dp | num_spike |
|---|---|---|---|---|---|
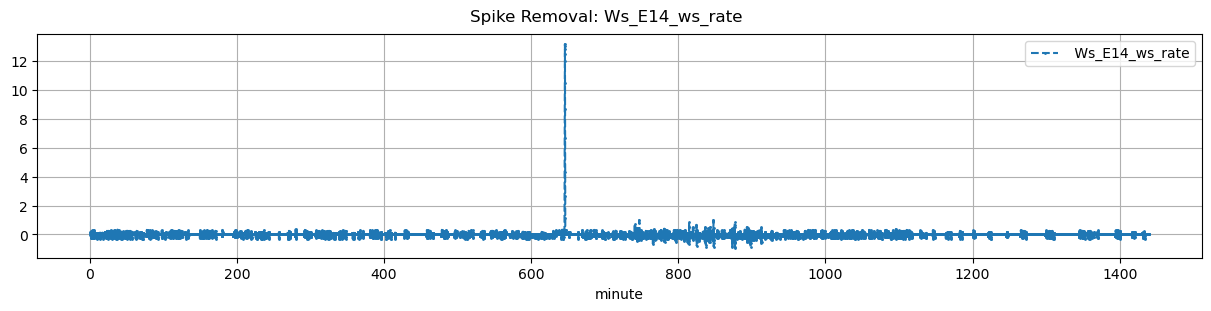
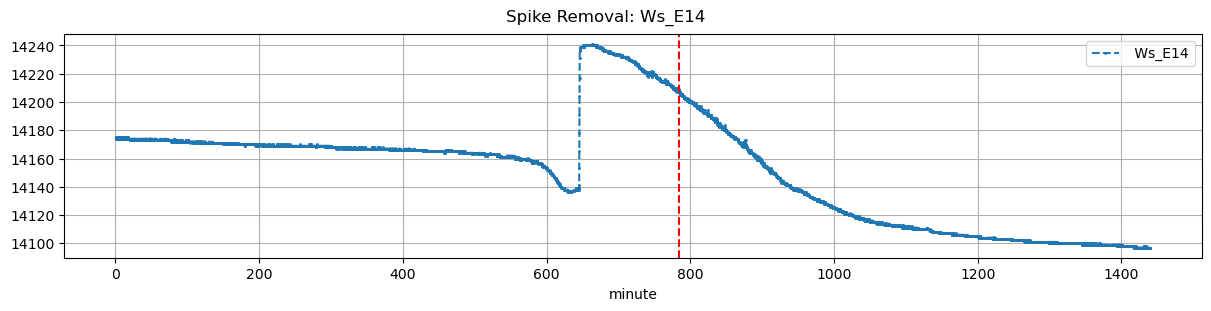
| Ws_E14 | 17270 | 0 | 14093 | 0 | 1 |
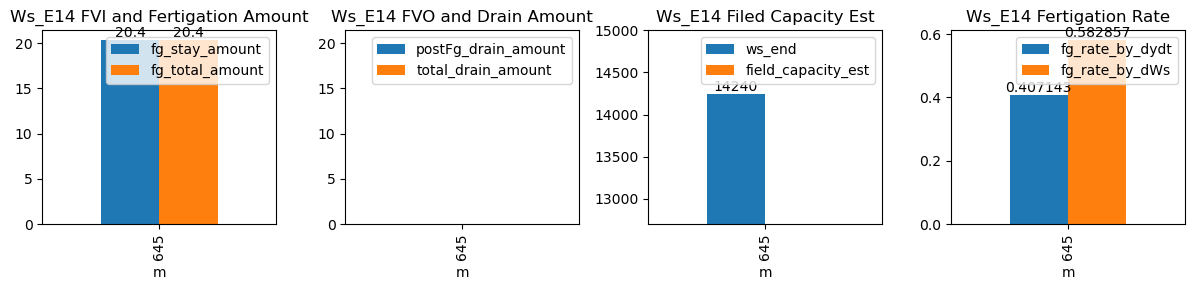
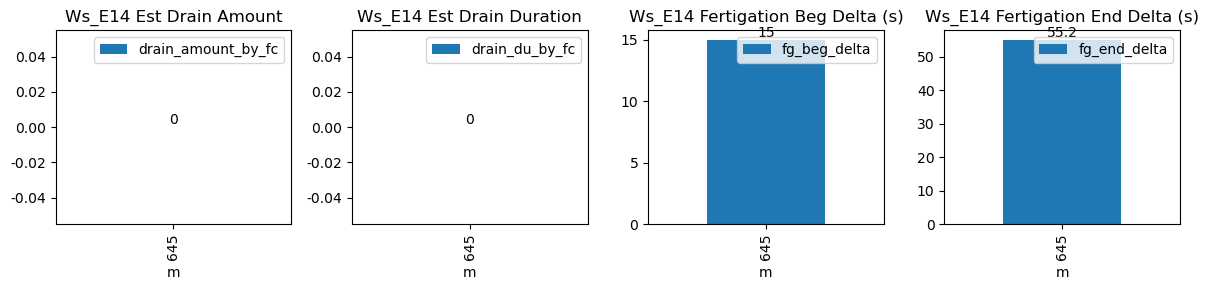
| ds | d | m | ws_name | prominence_cut | max_drain_du | fg_beg | fg_beg_est | fg_end | fg_end_est | drain_amount_by_fc | drain_du_by_fc | drain_rate_by_fc | ws_beg | ws_end | duc | pre_fg_et | post_fg_ws | post_drn_et | fg_rate_by_dydt | fg_rate_by_dWs | fg_stay_amount | fg_beg_delta | fg_end_delta | fg_total_amount | fg_drain_amount | postFg_drain_amount | field_capacity_est | total_drain_amount |
|---|---|---|---|---|---|---|---|---|---|---|---|---|---|---|---|---|---|---|---|---|---|---|---|---|---|---|---|---|
| 2026-02-01 10:45:00+08:00 | 118 | 645 | Ws_E14 | 0.207271 | 30 | 645.0 | 645.25 | 645.58 | 646.5 | NaN | NaN | NaN | 14138.0 | 14240.0 | 35 | 0.0 | 0.0 | -0.024444 | 0.407143 | 0.582857 | 20.4 | 15.0 | 55.2 | 20.4 | 0.0 | -0.909634 | NaN | -0.909634 |