| 2026-02-02 10:20:00+08:00 |
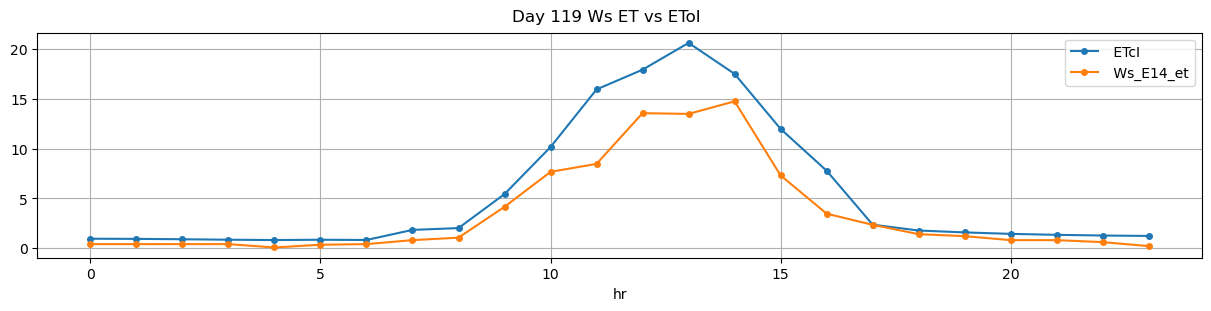
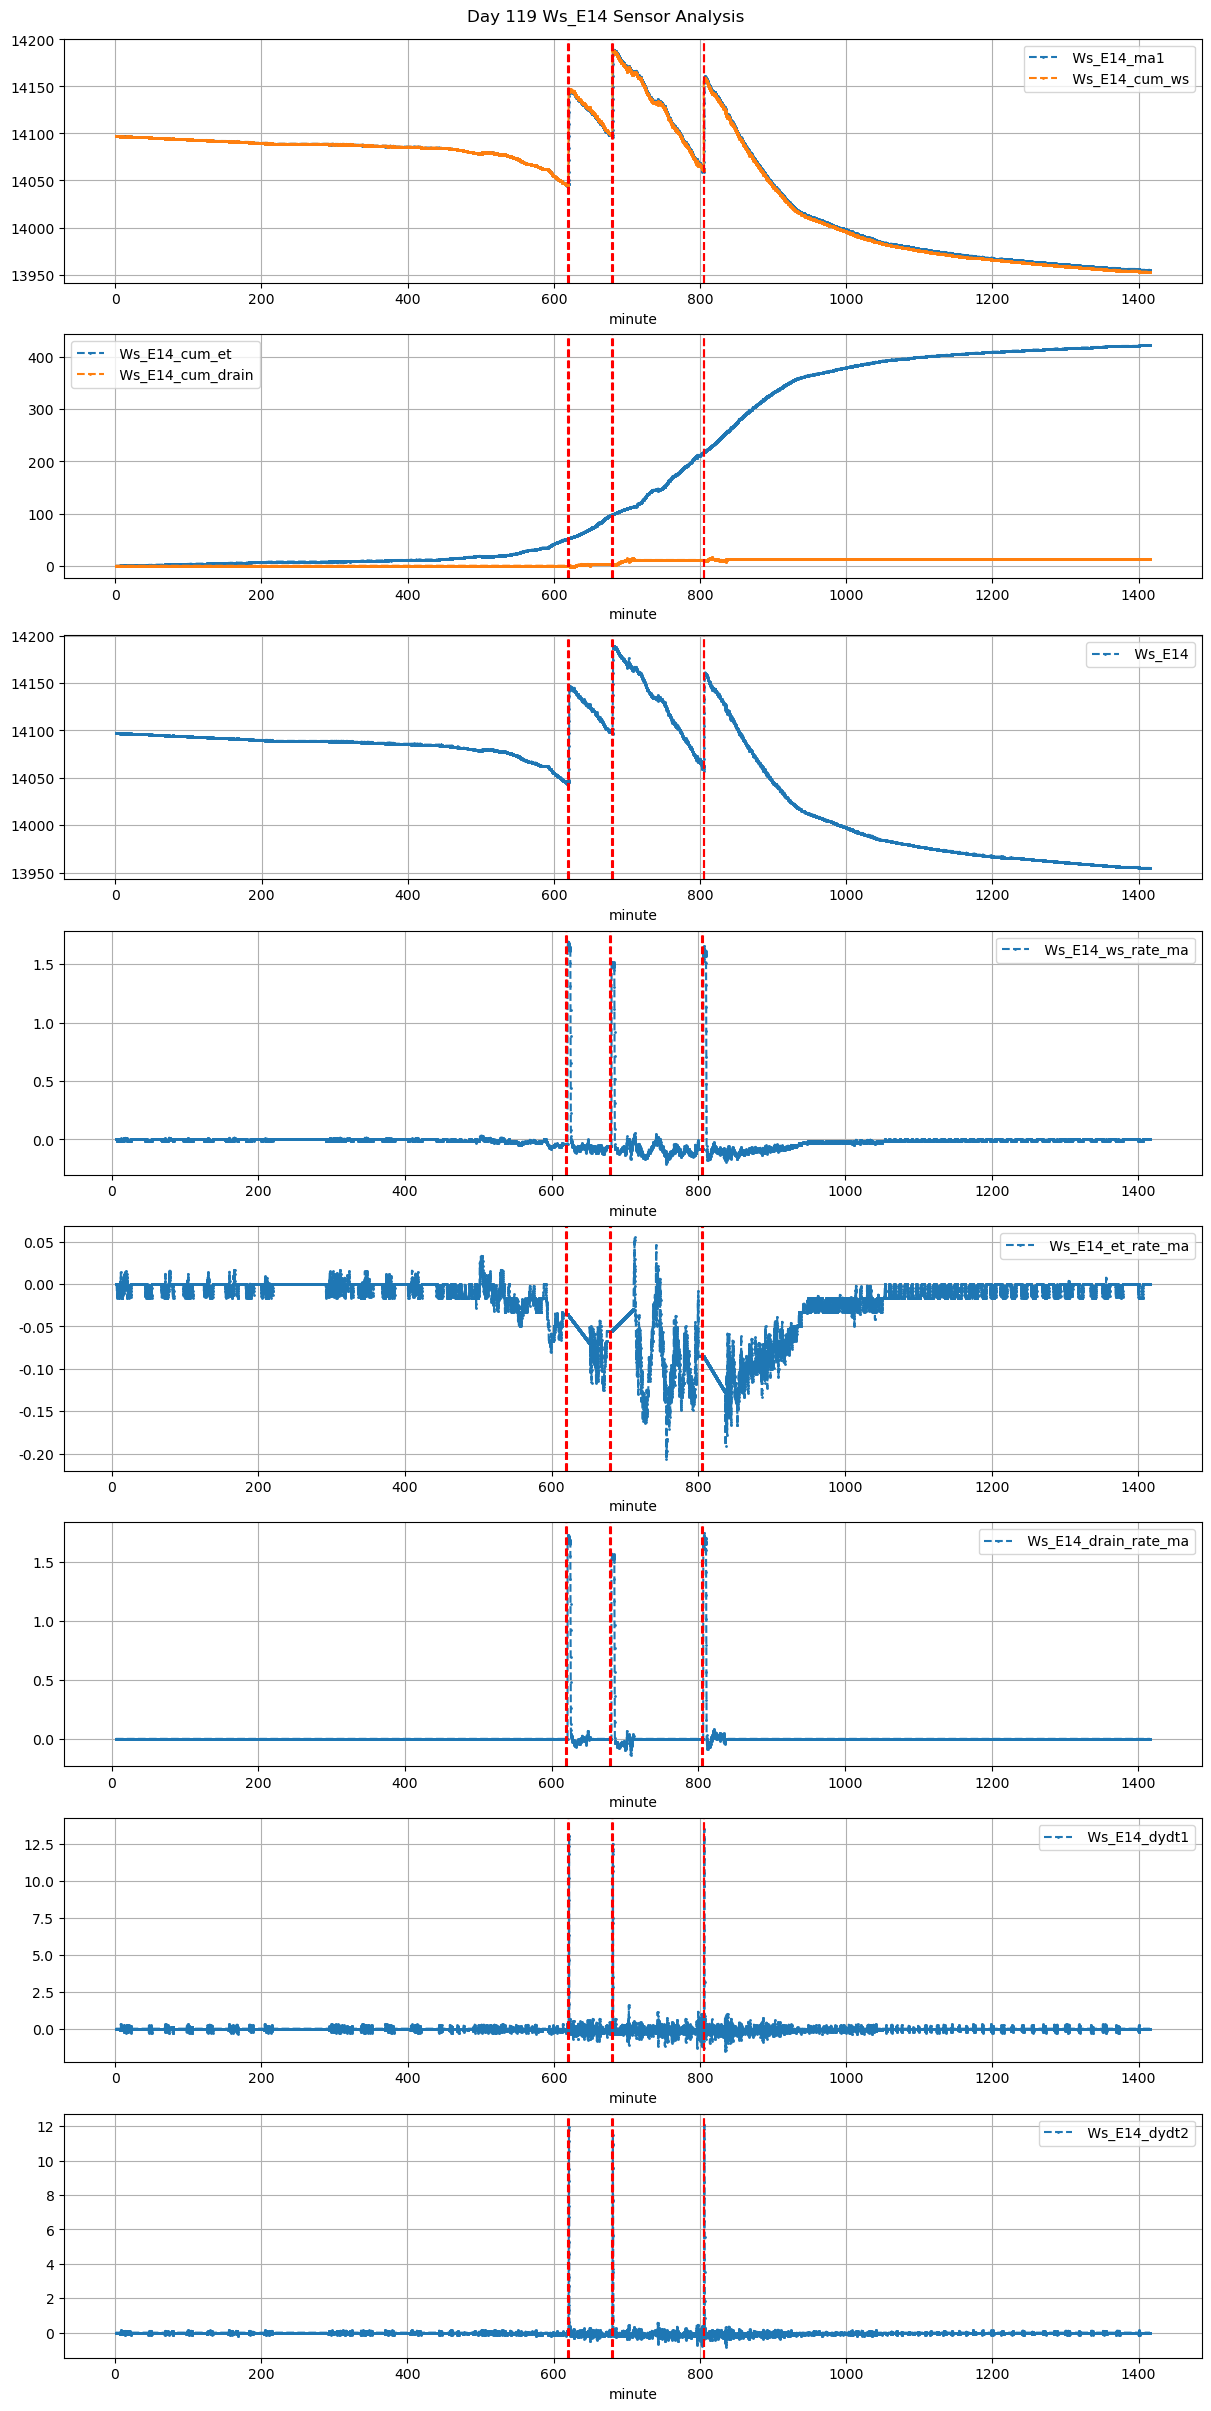
119 |
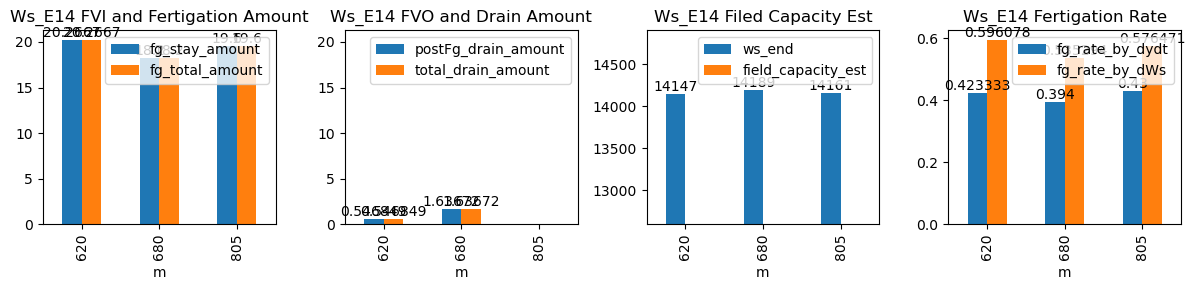
620 |
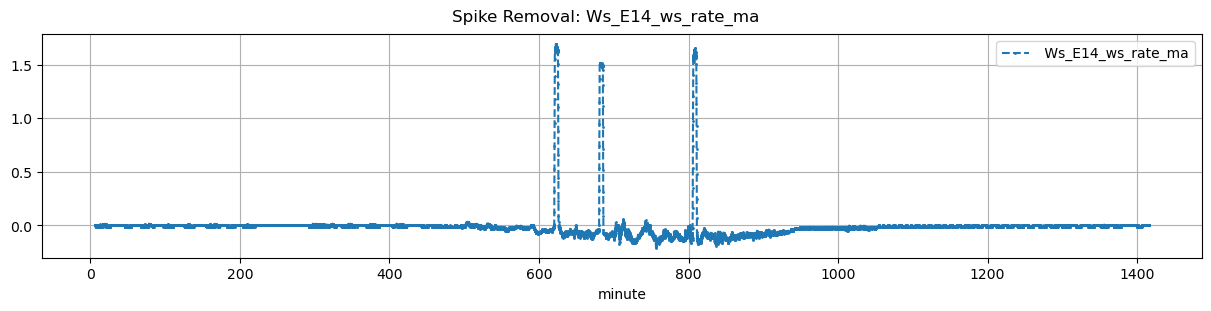
Ws_E14 |
0.339821 |
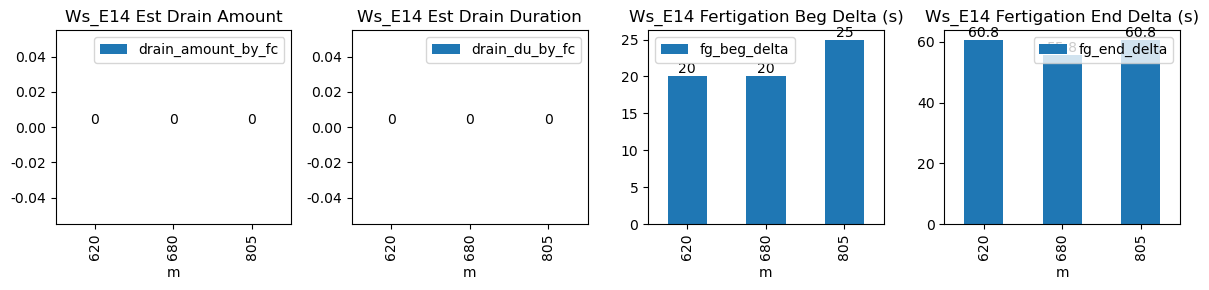
30 |
620.0 |
620.333333 |
620.57 |
621.583333 |
NaN |
NaN |
NaN |
14045.666667 |
14147.0 |
34 |
-0.035515 |
-0.055278 |
-0.070000 |
0.423333 |
0.596078 |
20.266667 |
20.0 |
60.8 |
20.266667 |
0.0 |
0.546849 |
NaN |
0.546849 |
| 2026-02-02 11:20:00+08:00 |
119 |
680 |
Ws_E14 |
0.339821 |
30 |
680.0 |
680.333333 |
680.57 |
681.500000 |
NaN |
NaN |
NaN |
14098.000000 |
14189.0 |
34 |
-0.055399 |
-0.093056 |
-0.029306 |
0.394000 |
0.535294 |
18.200000 |
20.0 |
55.8 |
18.200000 |
0.0 |
1.636723 |
NaN |
1.636723 |
| 2026-02-02 13:25:00+08:00 |
119 |
805 |
Ws_E14 |
0.339821 |
30 |
805.0 |
805.416667 |
805.57 |
806.583333 |
NaN |
NaN |
NaN |
14063.000000 |
14161.0 |
34 |
-0.084605 |
-0.149861 |
-0.128009 |
0.430000 |
0.576471 |
19.600000 |
25.0 |
60.8 |
19.600000 |
0.0 |
-0.062952 |
NaN |
-0.062952 |