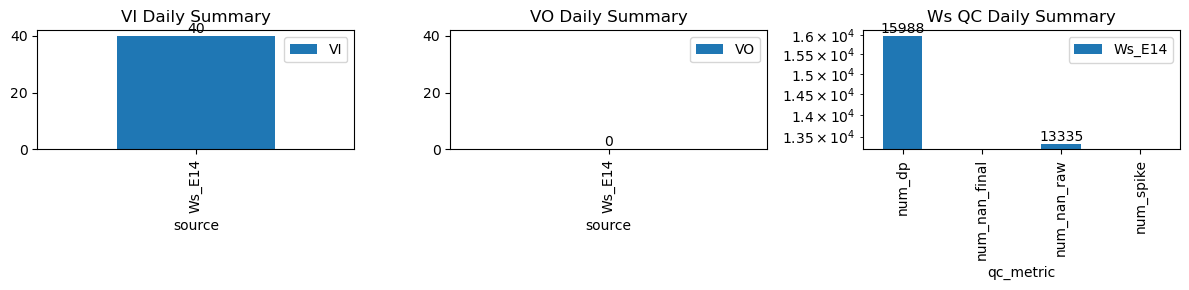
VI and VO Daily Summary
| ws_name | num_dp | num_nan_raw | num_nan_final | num_spike | cum_step_adj |
|---|---|---|---|---|---|
| Ws_E14 | 15,988 | 13,335 | 0 | 0 | 0.00 |
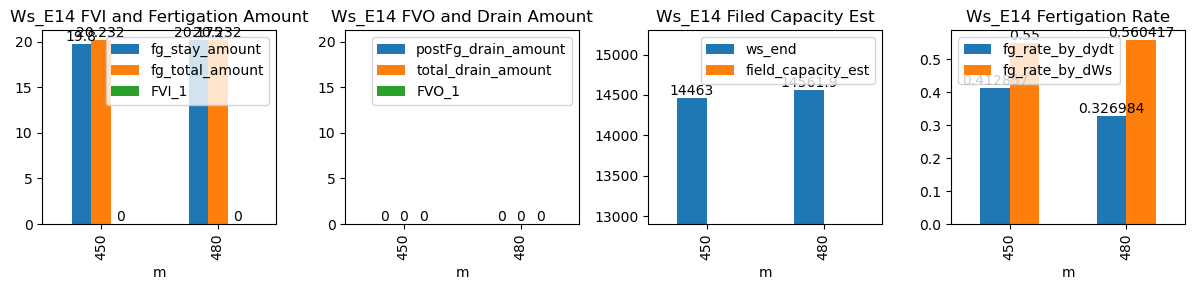
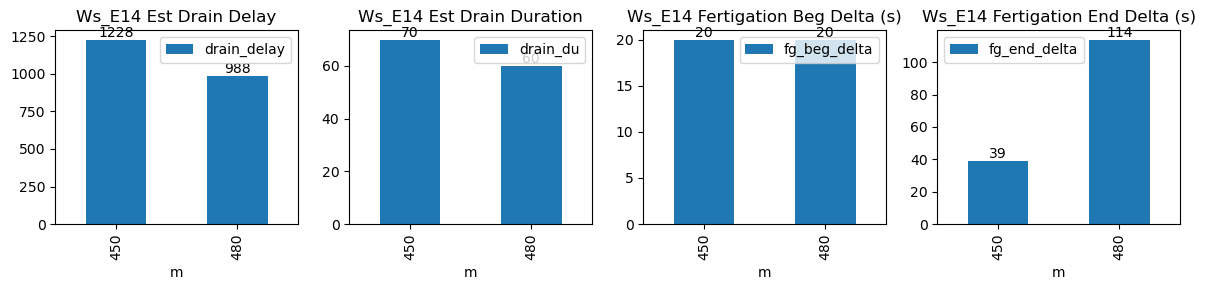
| ds | d | m | ws_name | prominence_cut | max_drain_du | fg_beg | fg_beg_est | fg_end | fg_end_est | ws_beg | ws_end | duc | pre_fg_et | post_fg_ws | post_drn_et | fg_rate_by_dydt | fg_rate_by_dWs | fg_stay_amount | enough_data | fg_beg_delta | fg_end_delta | fg_total_amount | fg_drain_amount | postFg_drain_amount | total_drain_amount | drain_du | drain_delay | drain_rate | field_capacity_est | FVI_1 | FVO_1 |
|---|---|---|---|---|---|---|---|---|---|---|---|---|---|---|---|---|---|---|---|---|---|---|---|---|---|---|---|---|---|---|---|
| 2026-02-06 07:30:00+08:00 | 123 | 450 | Ws_E14 | 0.148107 | 28.833333 | 450.0 | 450.333333 | 450.6 | 451.166667 | 14364.0 | 14463.0 | 36 | 0.000000 | -0.001806 | 0.000000 | 0.415714 | 0.550000 | 19.8 | True | 20.0 | 34.0 | 20.232 | 0.0 | 0 | 0.0 | 10 | 718 | -0.277778 | NaN | NaN | NaN |
| 2026-02-06 08:00:00+08:00 | 123 | 480 | Ws_E14 | 0.148107 | 30.000000 | 480.0 | 480.333333 | 480.6 | 481.833333 | 14461.0 | 14562.0 | 36 | -0.011864 | -0.001667 | -0.008611 | 0.375905 | 0.561111 | 20.2 | True | 20.0 | 74.0 | 20.232 | 0.0 | 0 | 0.0 | 10 | 193 | -0.282160 | NaN | NaN | NaN |