| 2026-03-25 08:07:54+08:00 |
170 |
487 |
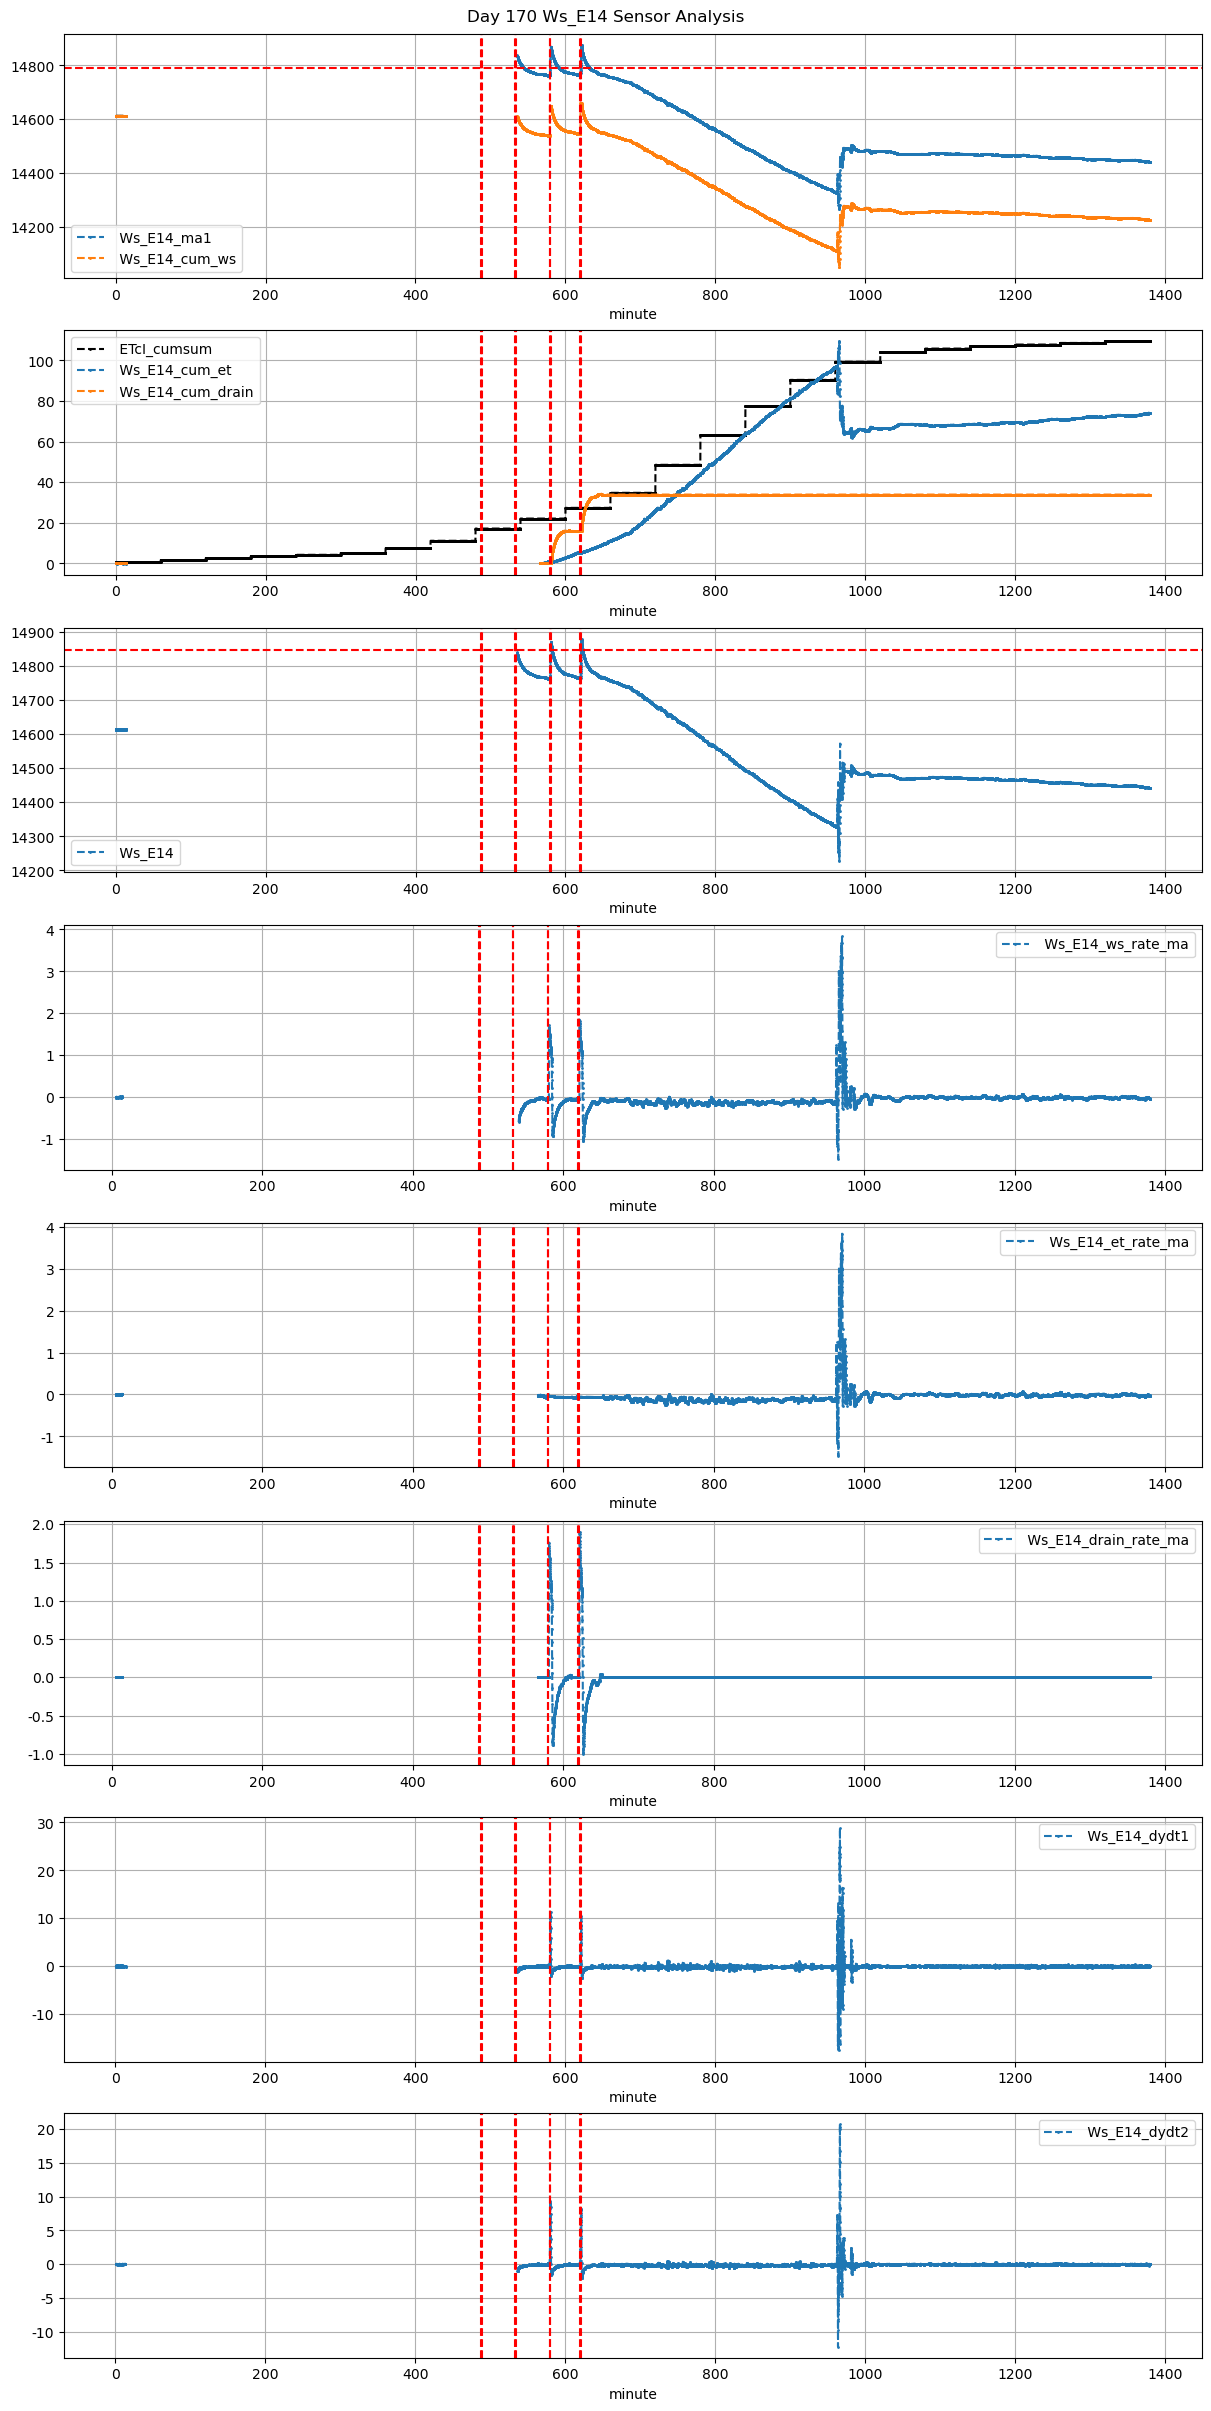
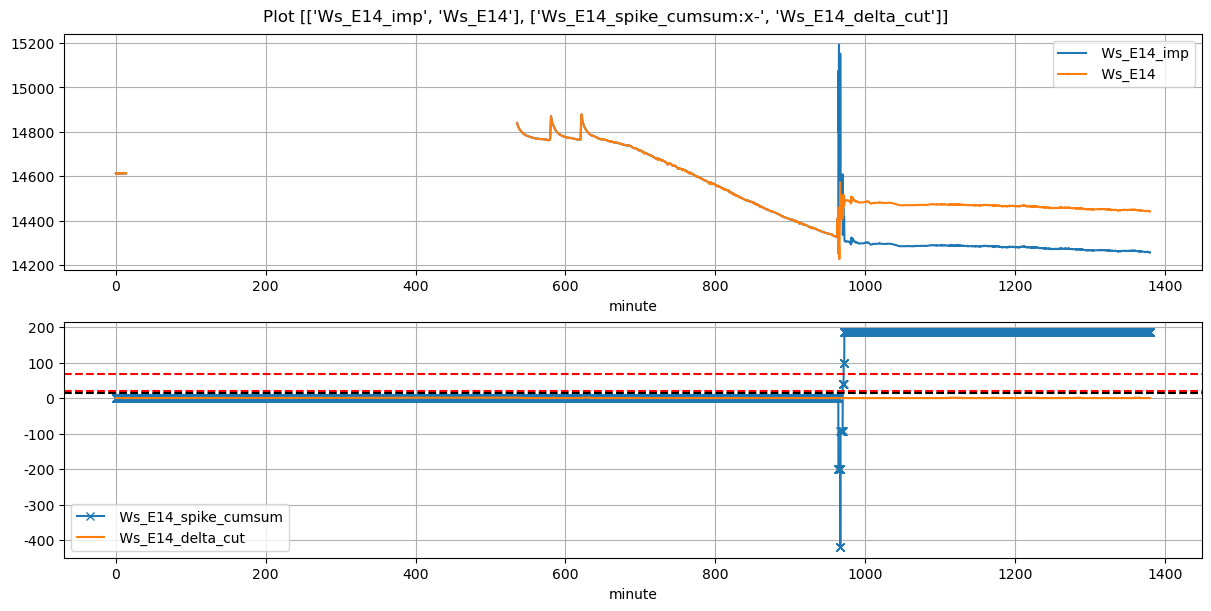
Ws_E14 |
1.642315 |
30 |
487.90 |
NaN |
488.75 |
NaN |
NaN |
NaN |
51 |
NaN |
NaN |
NaN |
NaN |
NaN |
NaN |
False |
NaN |
NaN |
NaN |
NaN |
NaN |
NaN |
NaN |
NaN |
NaN |
NaN |
NaN |
NaN |
| 2026-03-25 08:52:54+08:00 |
170 |
532 |
Ws_E14 |
1.642315 |
30 |
532.90 |
NaN |
533.75 |
535.583333 |
NaN |
14840.5 |
51 |
NaN |
-0.371681 |
NaN |
NaN |
NaN |
NaN |
False |
NaN |
110.0 |
NaN |
NaN |
NaN |
NaN |
NaN |
NaN |
NaN |
NaN |
NaN |
NaN |
| 2026-03-25 09:39:13+08:00 |
170 |
579 |
Ws_E14 |
1.642315 |
30 |
579.22 |
579.5 |
580.07 |
580.833333 |
14763.0 |
14871.0 |
51 |
-0.044427 |
-0.572333 |
-0.061591 |
0.334883 |
0.423529 |
21.6 |
True |
16.8 |
45.8 |
26.52 |
4.9 |
15.977888 |
20.877888 |
650.0 |
50.0 |
-1.154825 |
14791.110562 |
32.0 |
3.79 |
| 2026-03-25 10:20:00+08:00 |
170 |
620 |
Ws_E14 |
1.642315 |
30 |
620.00 |
620.0 |
620.85 |
621.416667 |
14765.0 |
14879.0 |
51 |
-0.050565 |
-0.602431 |
-0.065571 |
0.312550 |
0.447059 |
22.8 |
True |
0.0 |
34.0 |
26.52 |
3.7 |
17.771778 |
21.471778 |
744.0 |
44.0 |
-1.182079 |
14790.141109 |
42.0 |
116.09 |