| 2026-04-04 07:22:58+08:00 |
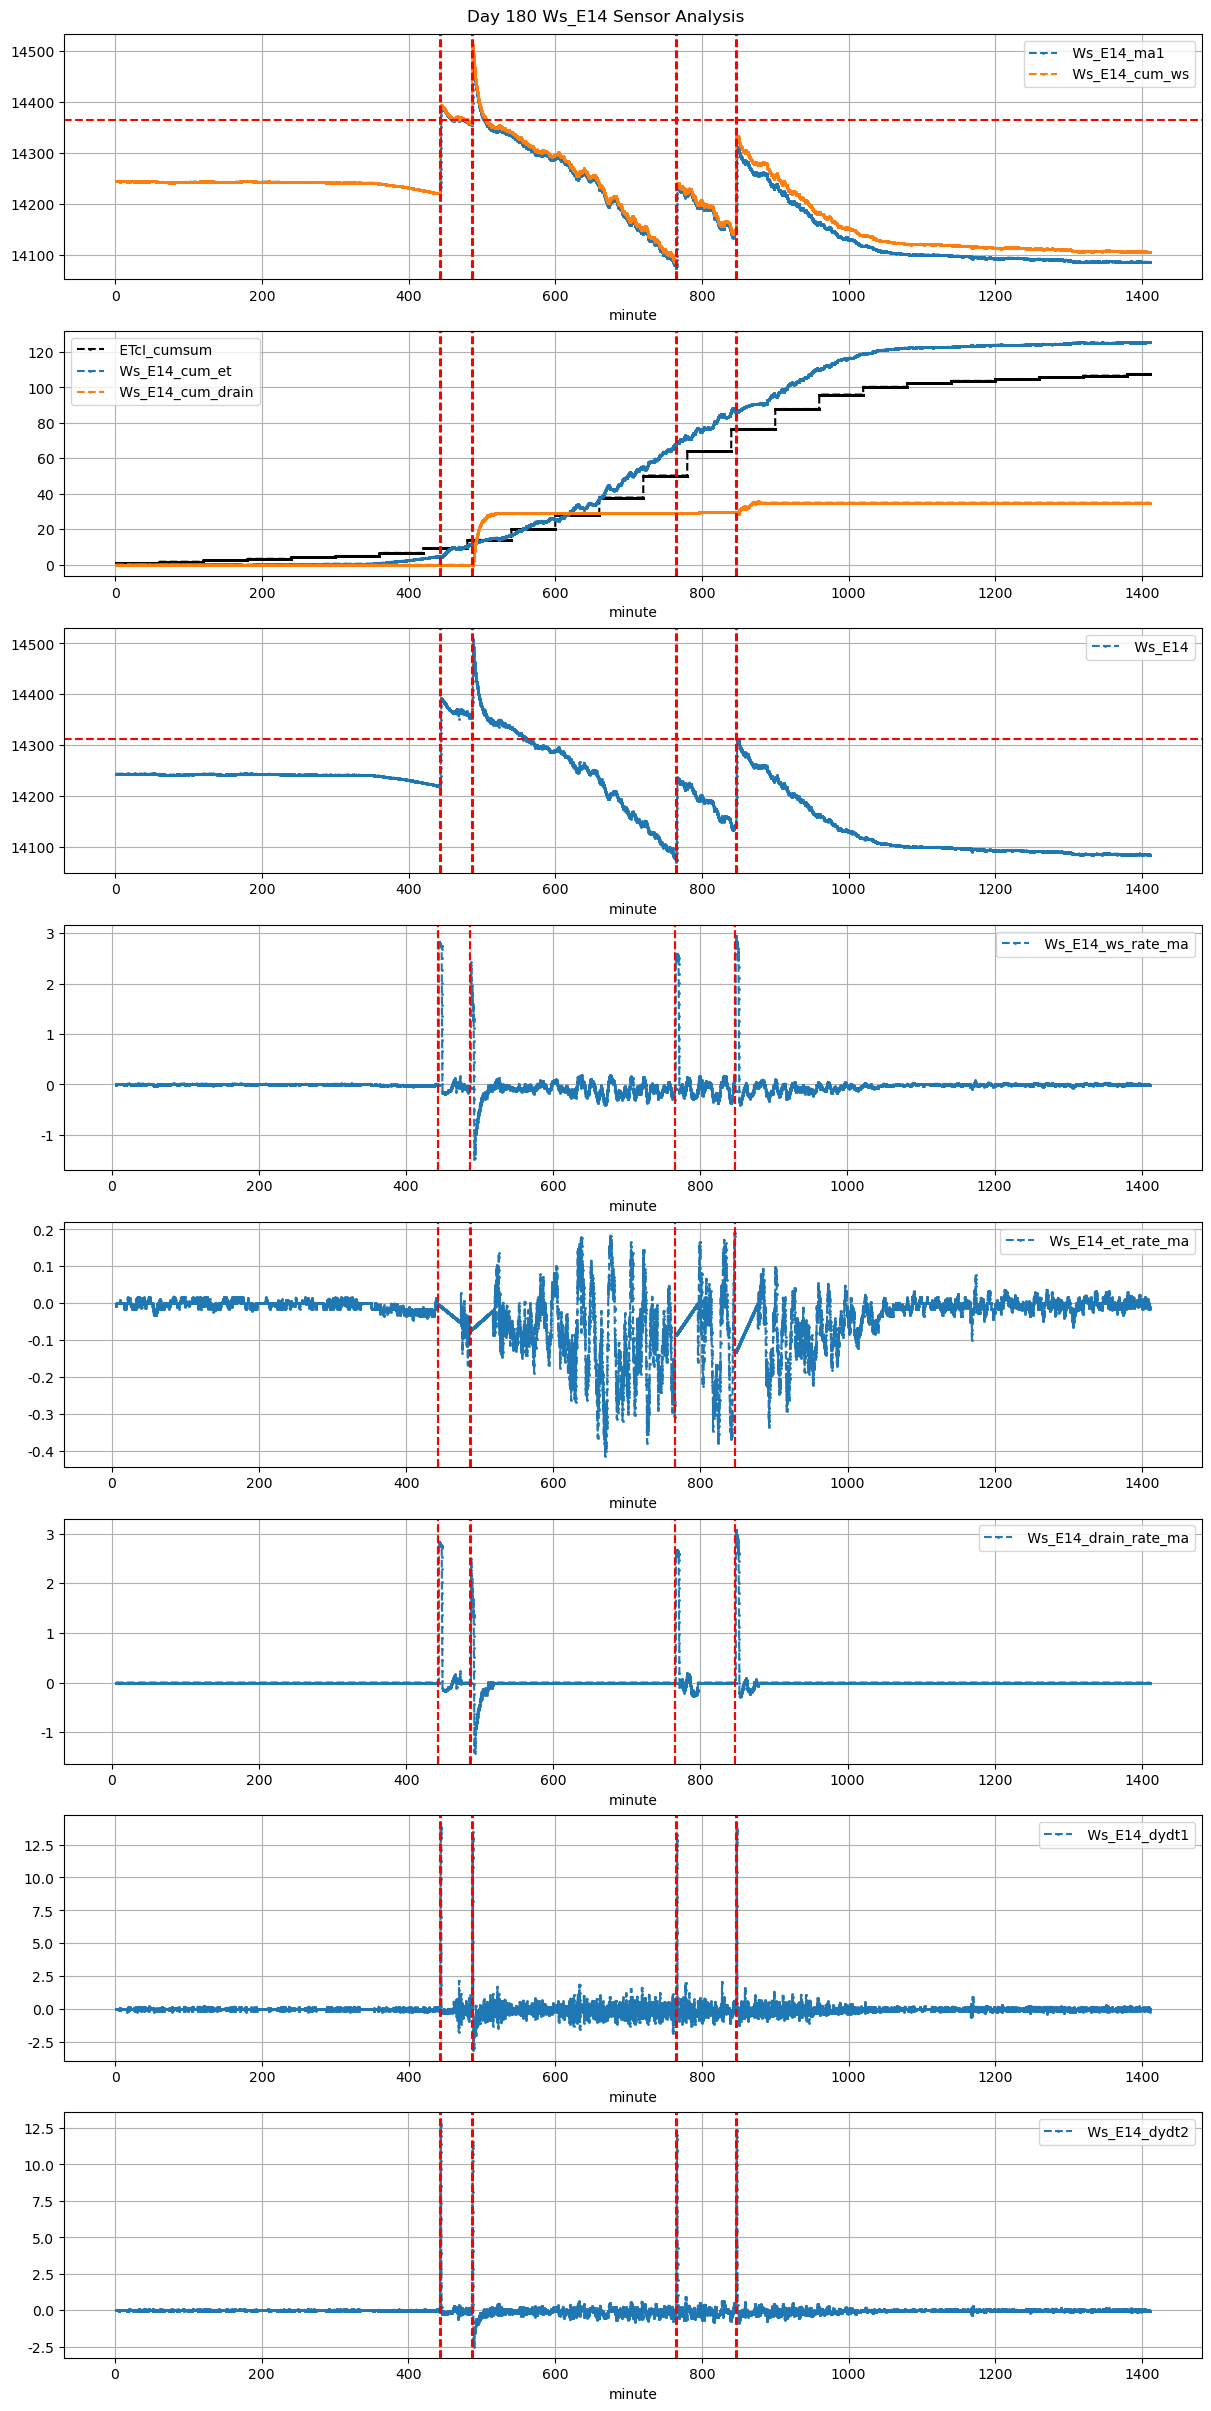
180 |
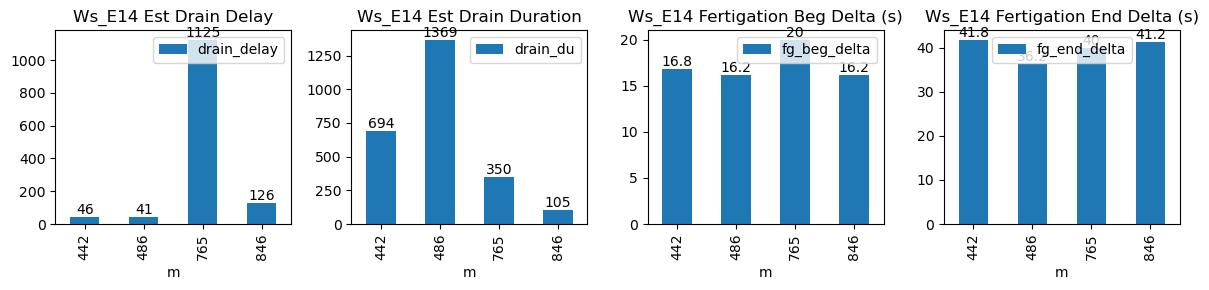
442 |
Ws_E14 |
0.766551 |
30 |
442.97 |
443.250000 |
443.97 |
444.5 |
14220.981818 |
14392.5 |
60 |
-0.004655 |
-0.169757 |
-0.052801 |
0.477375 |
0.571727 |
34.303636 |
True |
16.8 |
31.8 |
34.303636 |
0.0 |
0.000000 |
0.000000 |
9 |
1331 |
-0.528666 |
NaN |
NaN |
NaN |
| 2026-04-04 08:06:29+08:00 |
180 |
486 |
Ws_E14 |
0.766551 |
30 |
486.48 |
486.750000 |
487.48 |
488.0 |
14356.000000 |
14509.0 |
60 |
-0.072361 |
-0.918056 |
-0.019838 |
0.428472 |
0.510000 |
30.600000 |
True |
16.2 |
31.2 |
33.060000 |
2.5 |
28.706217 |
31.206217 |
210 |
41 |
-1.689190 |
14365.468917 |
NaN |
NaN |
| 2026-04-04 12:45:00+08:00 |
180 |
765 |
Ws_E14 |
0.766551 |
30 |
765.00 |
765.333333 |
766.00 |
766.5 |
14079.000000 |
14237.0 |
60 |
-0.211205 |
-0.086863 |
0.000000 |
0.444972 |
0.526667 |
31.600000 |
True |
20.0 |
30.0 |
33.060000 |
0.0 |
0.000000 |
0.000000 |
25 |
444 |
-0.883358 |
NaN |
NaN |
NaN |
| 2026-04-04 14:06:29+08:00 |
180 |
846 |
Ws_E14 |
0.766551 |
30 |
846.48 |
846.750000 |
847.48 |
848.0 |
14134.950000 |
14313.0 |
60 |
-0.131725 |
-0.299676 |
0.000000 |
0.465417 |
0.593500 |
35.610000 |
True |
16.2 |
31.2 |
35.610000 |
0.0 |
5.817862 |
5.817862 |
120 |
181 |
-0.650366 |
NaN |
NaN |
NaN |