| 2026-04-03 07:30:00+08:00 |
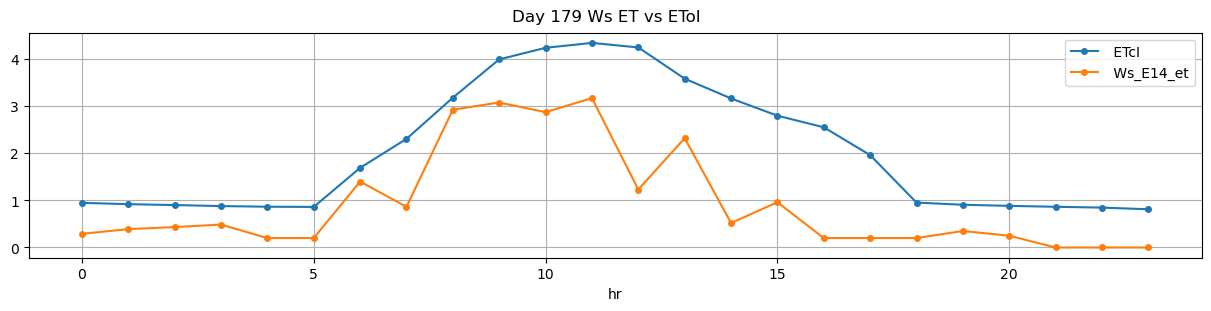
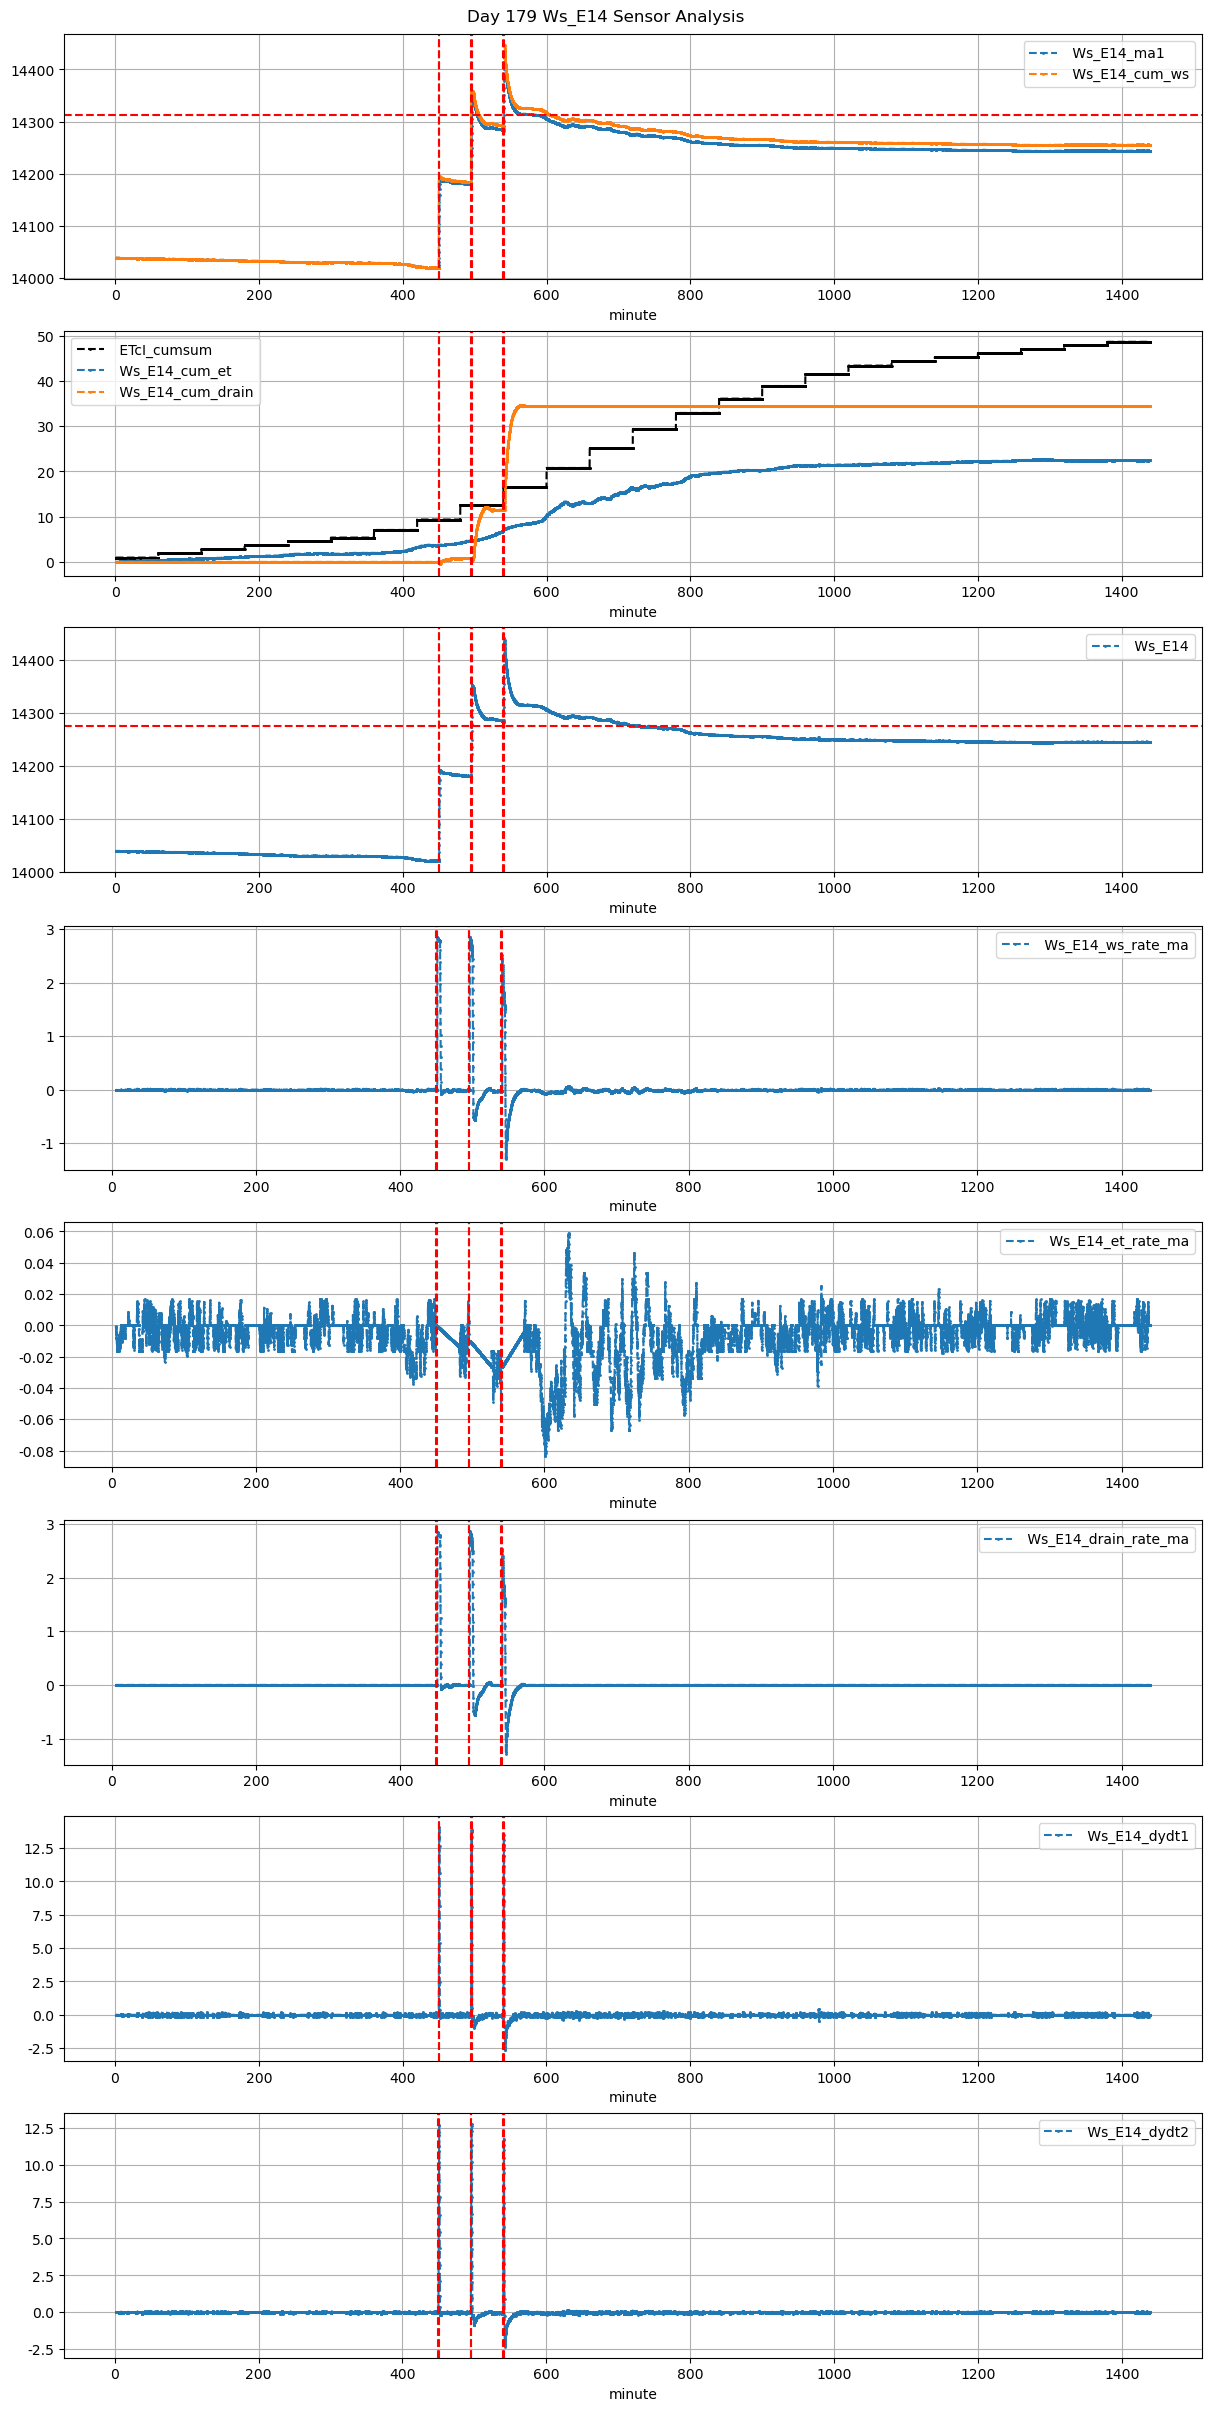
179 |
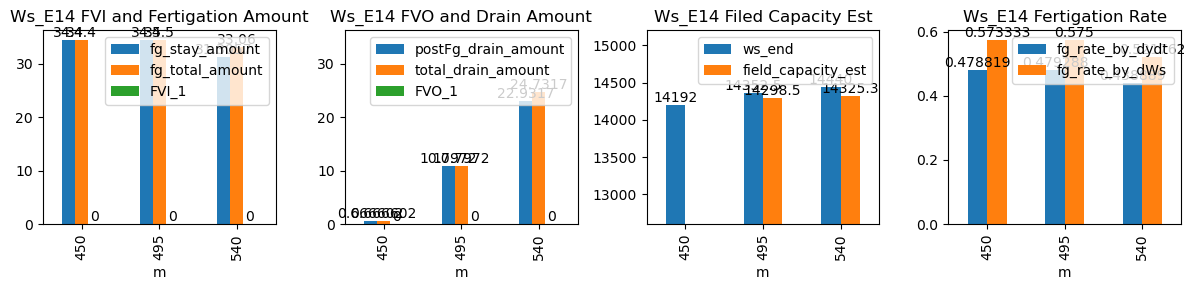
450 |
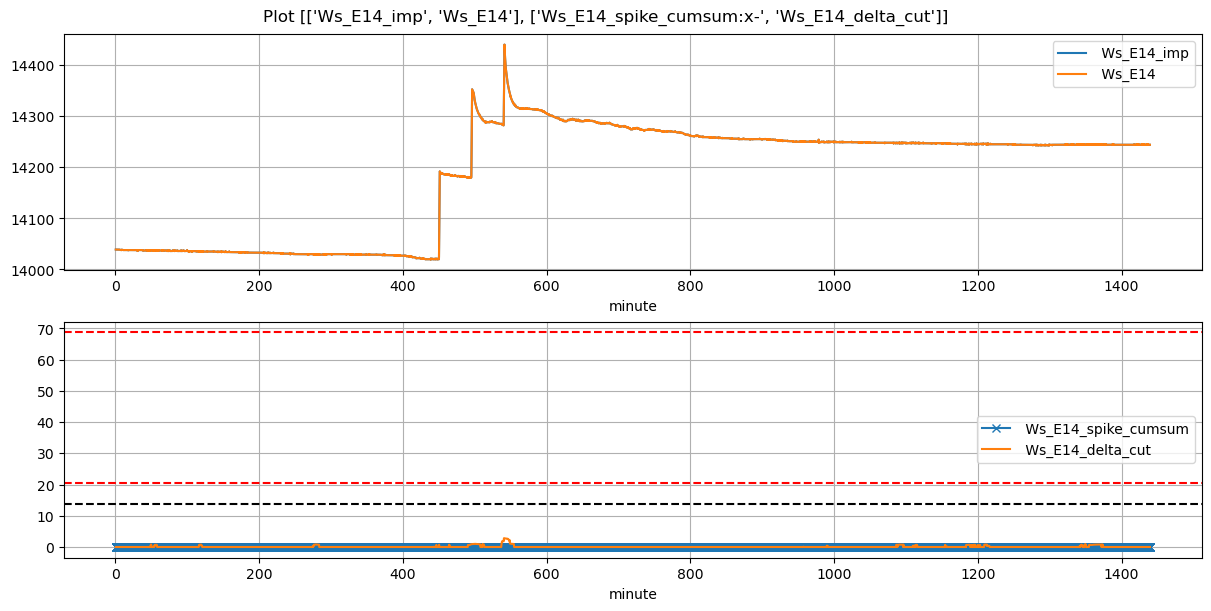
Ws_E14 |
0.476944 |
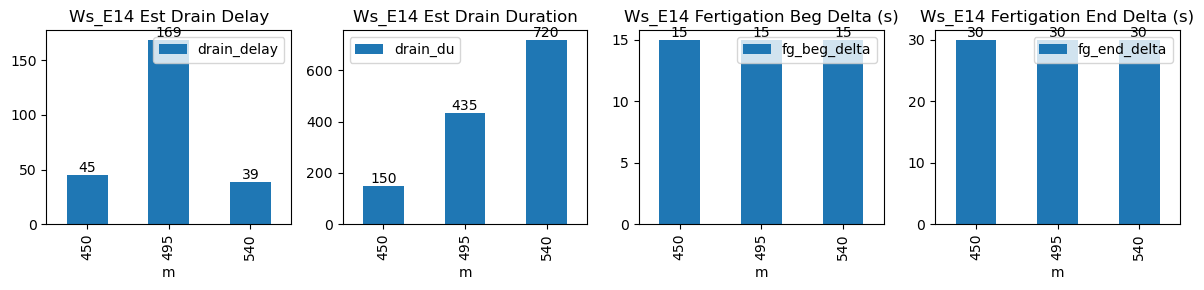
30 |
450.0 |
450.25 |
451.0 |
451.5 |
14020.000000 |
14192.0 |
60 |
-0.000659 |
-0.039579 |
-0.013449 |
0.478819 |
0.573333 |
34.400000 |
True |
15.0 |
30.0 |
34.40 |
0.0 |
0.666602 |
0.666602 |
150 |
45 |
-0.165471 |
NaN |
NaN |
NaN |
| 2026-04-03 08:15:00+08:00 |
179 |
495 |
Ws_E14 |
0.476944 |
30 |
495.0 |
495.25 |
496.0 |
496.5 |
14180.000000 |
14352.5 |
60 |
-0.009805 |
-0.476713 |
-0.026389 |
0.479288 |
0.575000 |
34.500000 |
True |
15.0 |
30.0 |
34.50 |
0.0 |
10.797190 |
10.797190 |
435 |
169 |
-0.783343 |
14298.514052 |
NaN |
NaN |
| 2026-04-03 09:00:00+08:00 |
179 |
540 |
Ws_E14 |
0.476944 |
30 |
540.0 |
540.25 |
541.0 |
541.5 |
14283.471429 |
14440.0 |
60 |
-0.026318 |
-0.765463 |
-0.004086 |
0.438889 |
0.521762 |
31.305714 |
True |
15.0 |
30.0 |
33.06 |
1.8 |
22.931720 |
24.731720 |
720 |
39 |
-1.654821 |
14325.341398 |
NaN |
NaN |