| 2026-03-22 08:12:58+08:00 |
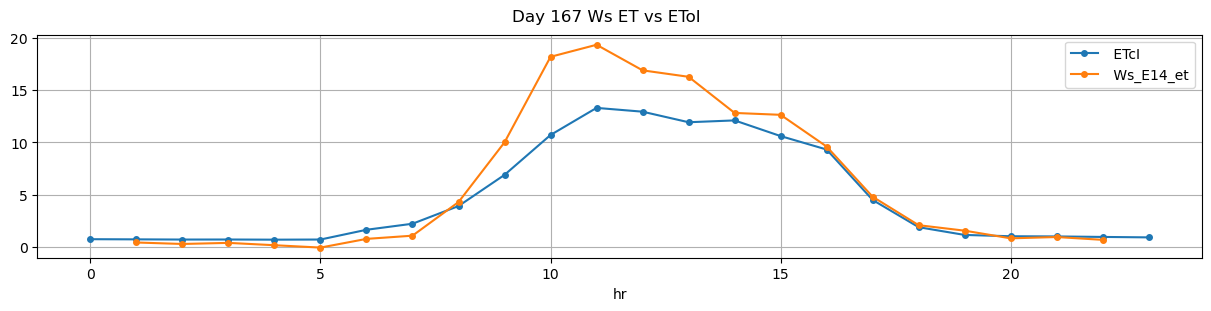
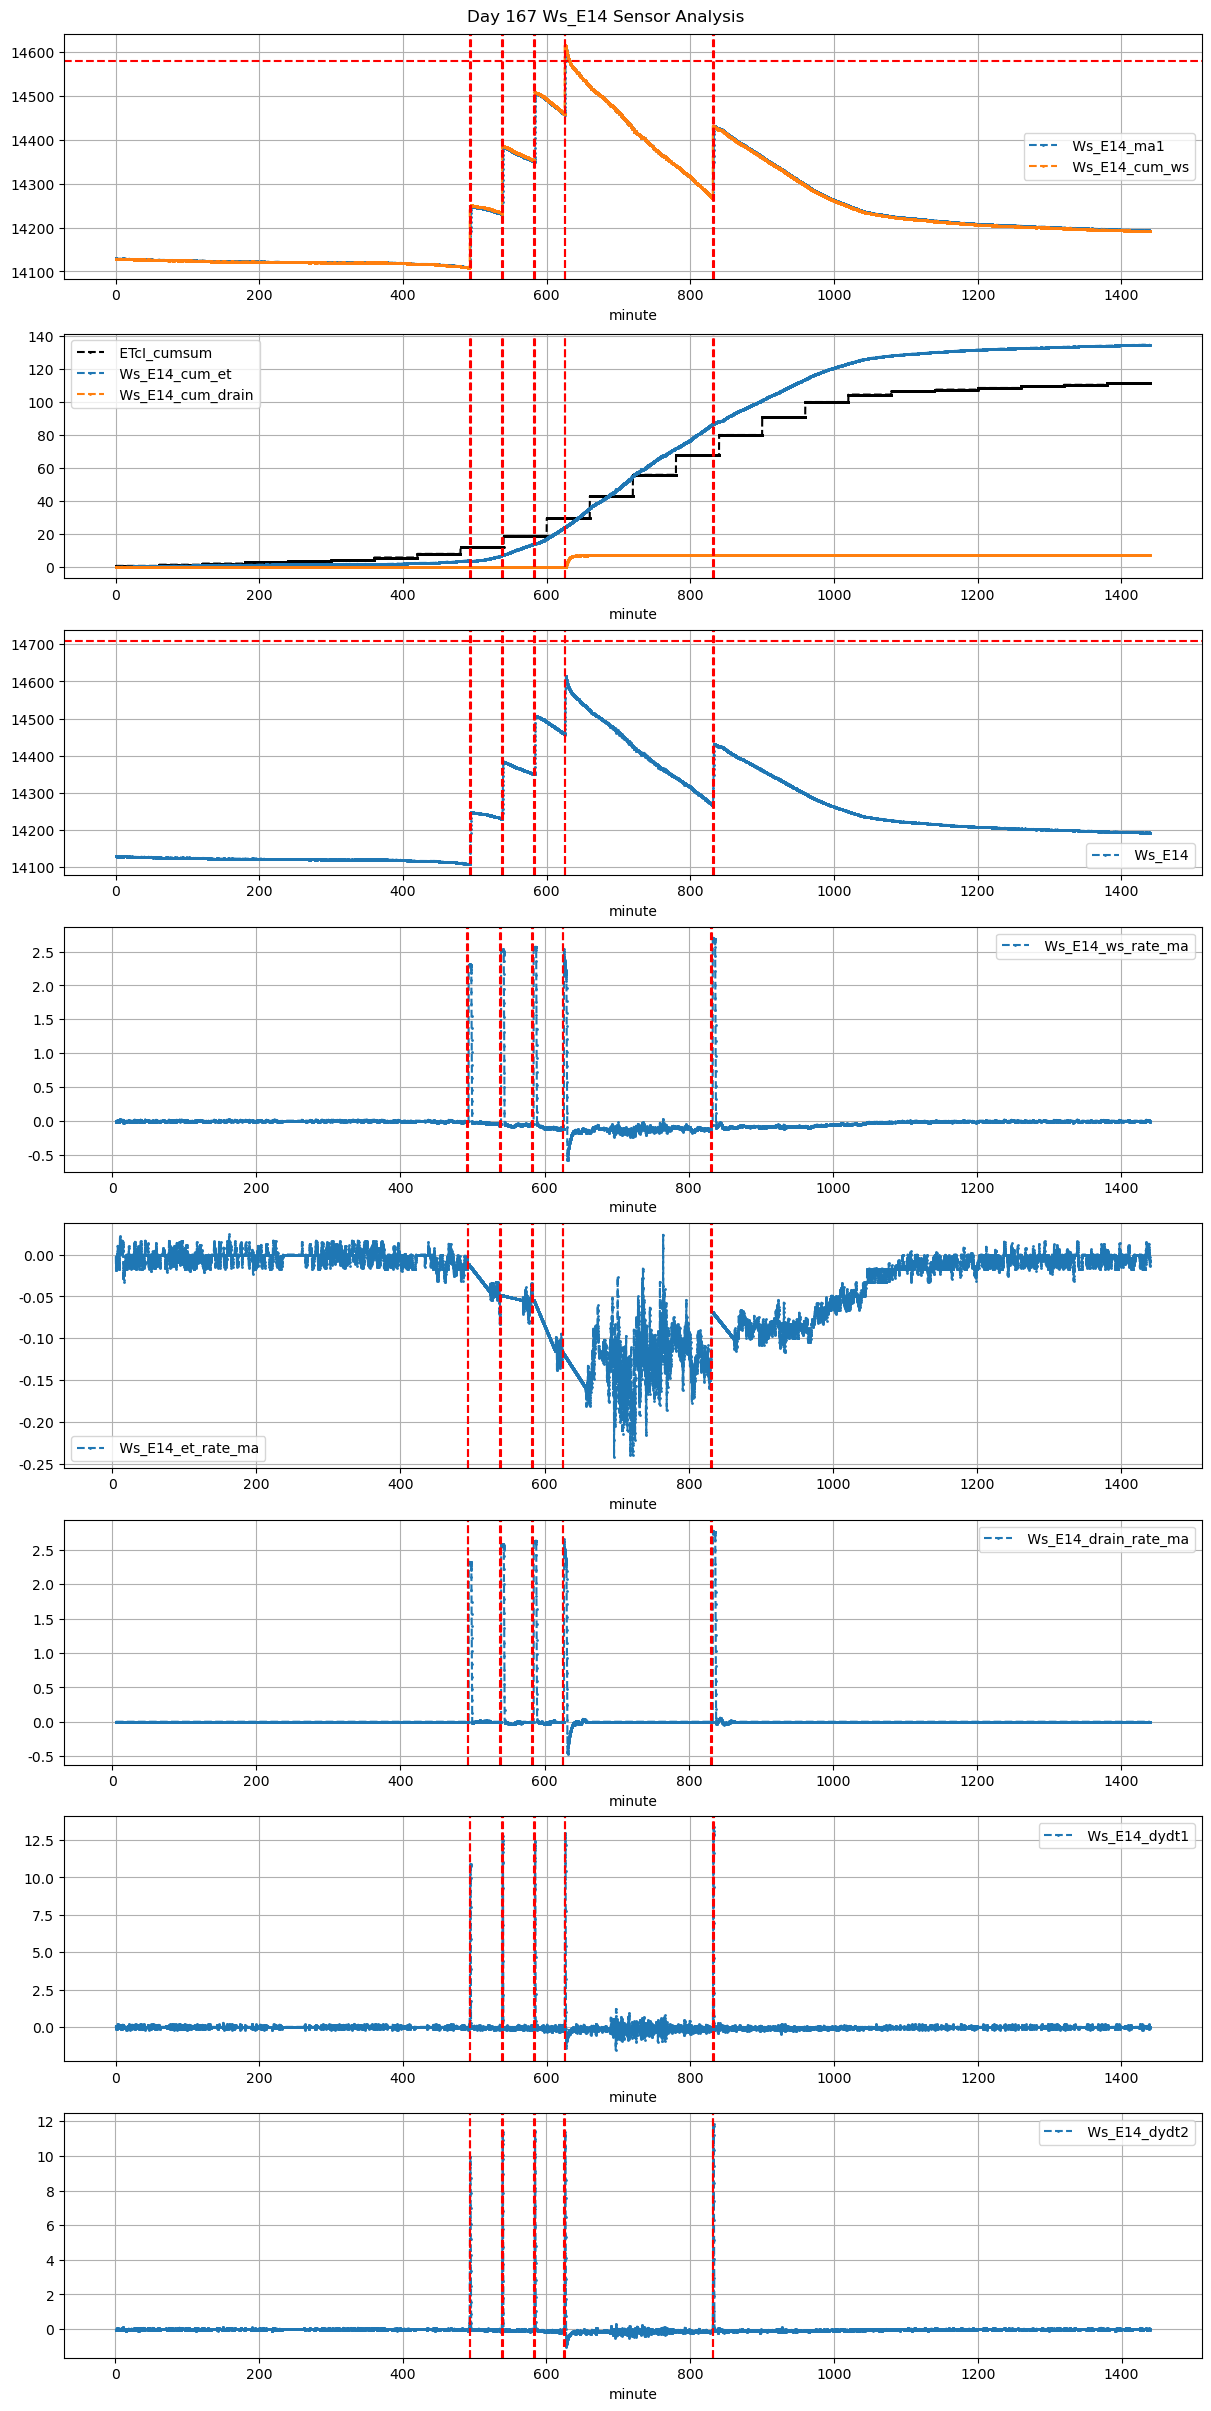
167 |
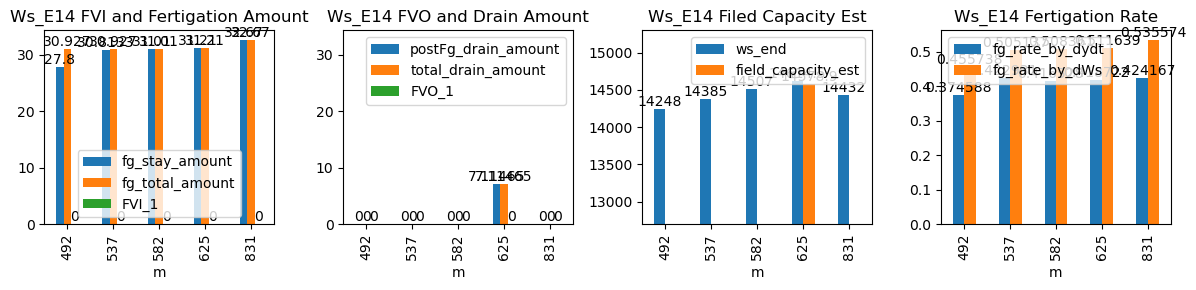
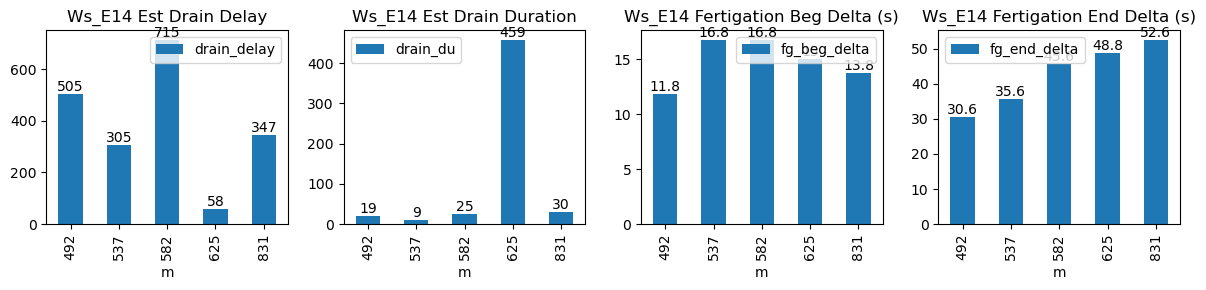
492 |
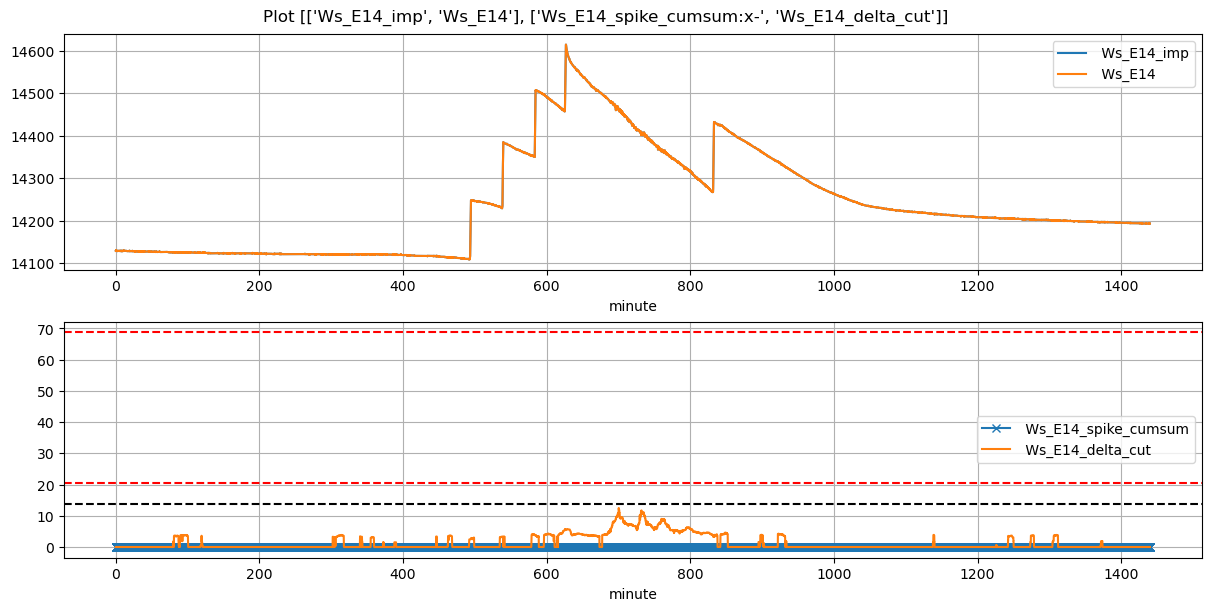
Ws_E14 |
0.342884 |
30 |
492.97 |
493.166667 |
493.99 |
494.500000 |
14109.000000 |
14248.0 |
61 |
-0.011744 |
-0.025810 |
-0.044792 |
0.374588 |
0.455738 |
27.800000 |
True |
11.8 |
30.6 |
30.927 |
0.0 |
0.000000 |
0.000000 |
19 |
505 |
-0.125515 |
NaN |
NaN |
NaN |
| 2026-03-22 08:57:58+08:00 |
167 |
537 |
Ws_E14 |
0.342884 |
30 |
537.97 |
538.250000 |
538.99 |
539.583333 |
14230.933333 |
14385.0 |
61 |
-0.048318 |
-0.062375 |
-0.054563 |
0.422931 |
0.505137 |
30.813333 |
True |
16.8 |
35.6 |
30.927 |
0.0 |
0.000000 |
0.000000 |
9 |
305 |
-0.129453 |
NaN |
NaN |
NaN |
| 2026-03-22 09:42:58+08:00 |
167 |
582 |
Ws_E14 |
0.342884 |
30 |
582.97 |
583.250000 |
583.99 |
584.750000 |
14351.950000 |
14507.0 |
61 |
-0.054333 |
-0.073299 |
-0.115231 |
0.416528 |
0.508361 |
31.010000 |
True |
16.8 |
45.6 |
31.010 |
0.0 |
0.000000 |
0.000000 |
25 |
715 |
-0.207679 |
NaN |
NaN |
NaN |
| 2026-03-22 10:25:00+08:00 |
167 |
625 |
Ws_E14 |
0.342884 |
30 |
625.00 |
625.250000 |
626.02 |
626.833333 |
14458.450000 |
14614.5 |
61 |
-0.119303 |
-0.371047 |
-0.159167 |
0.418722 |
0.511639 |
31.210000 |
True |
15.0 |
48.8 |
31.210 |
0.0 |
7.114646 |
7.114646 |
459 |
58 |
-0.661214 |
14578.926771 |
NaN |
NaN |
| 2026-03-22 13:51:16+08:00 |
167 |
831 |
Ws_E14 |
0.342884 |
30 |
831.27 |
831.500000 |
832.29 |
833.166667 |
14268.650000 |
14432.0 |
61 |
-0.136192 |
-0.069067 |
-0.101566 |
0.424167 |
0.535574 |
32.670000 |
True |
13.8 |
52.6 |
32.670 |
0.0 |
0.000000 |
0.000000 |
30 |
347 |
-0.170485 |
NaN |
NaN |
NaN |