| 2026-03-21 08:11:21+08:00 |
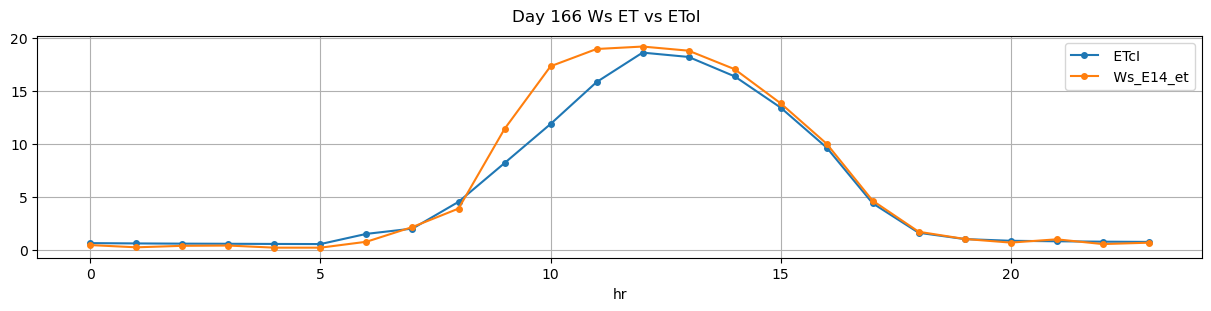
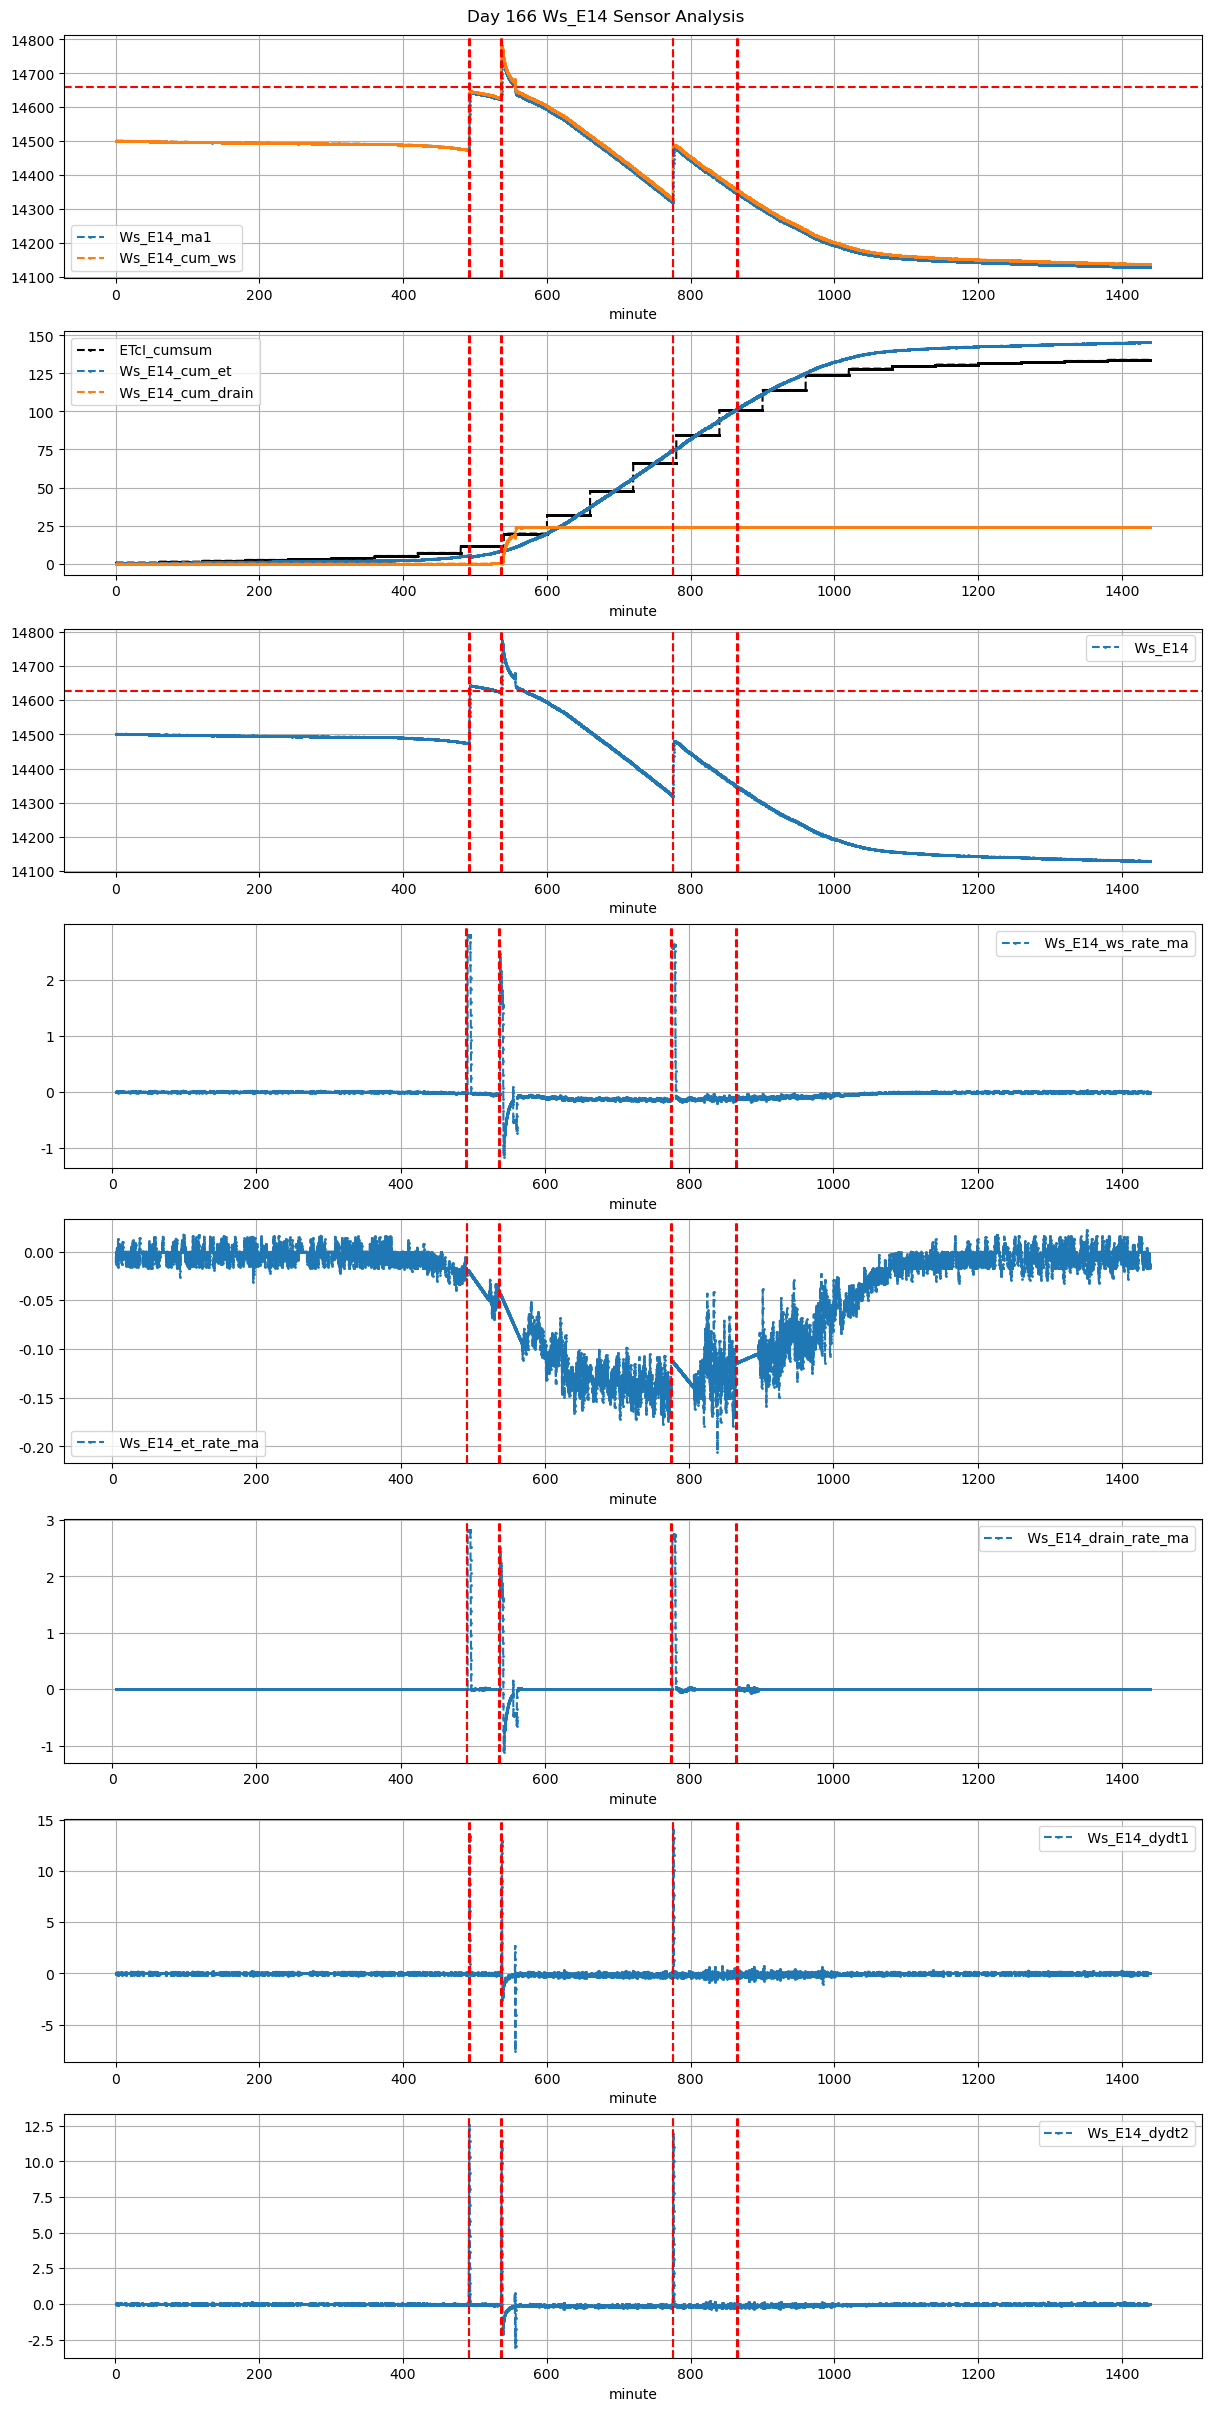
166 |
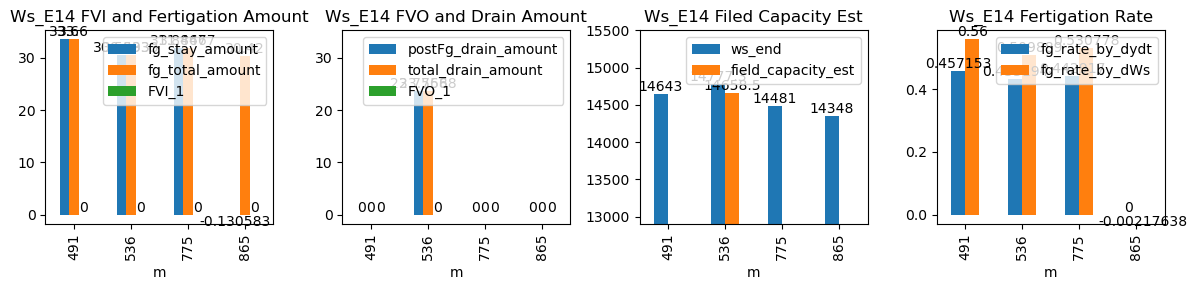
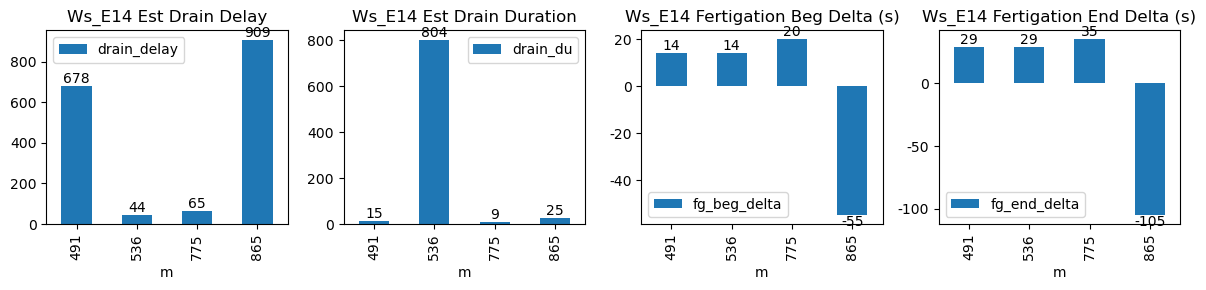
491 |
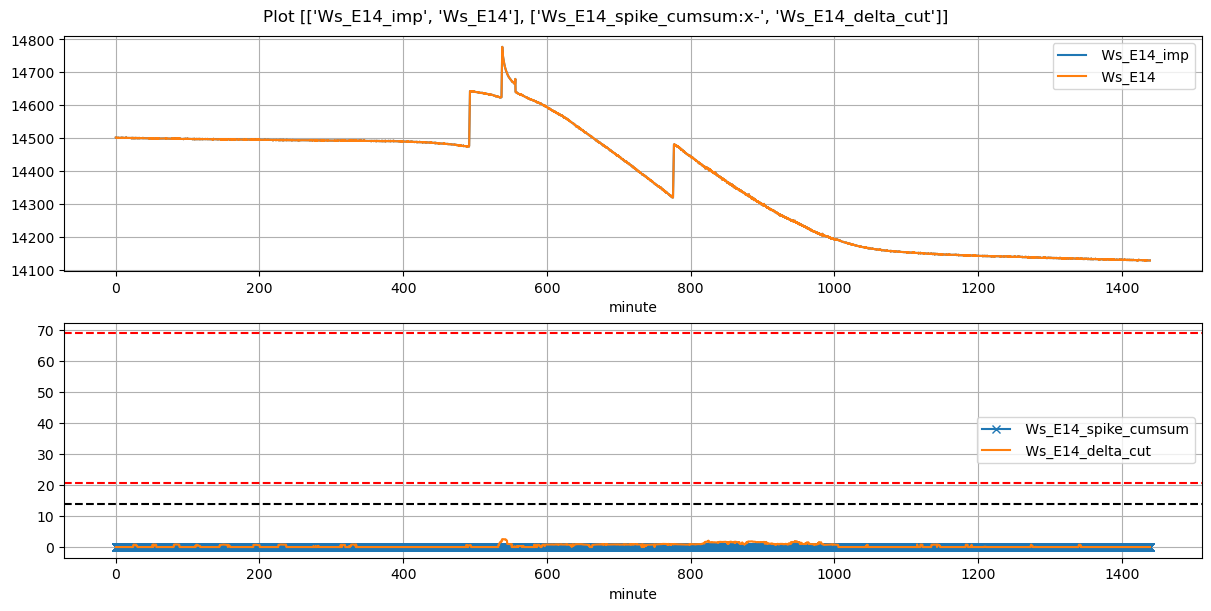
Ws_E14 |
0.557559 |
30 |
491.35 |
491.583333 |
492.35 |
492.833333 |
14475.000000 |
14643.000000 |
60 |
-0.018640 |
-0.029380 |
-0.050097 |
0.457153 |
0.560000 |
33.600000 |
True |
14.0 |
29.0 |
33.600000 |
0.0 |
0.000000 |
0.000000 |
15 |
678 |
-0.126237 |
NaN |
NaN |
NaN |
| 2026-03-21 08:56:21+08:00 |
166 |
536 |
Ws_E14 |
0.557559 |
30 |
536.35 |
536.583333 |
537.35 |
537.833333 |
14624.366667 |
14777.333333 |
60 |
-0.043342 |
-0.663611 |
-0.093889 |
0.433194 |
0.509889 |
30.593333 |
True |
14.0 |
29.0 |
30.593333 |
0.0 |
23.756812 |
23.756812 |
804 |
44 |
-1.729806 |
14658.549275 |
NaN |
NaN |
| 2026-03-21 12:55:00+08:00 |
166 |
775 |
Ws_E14 |
0.557559 |
30 |
775.00 |
775.333333 |
776.00 |
776.583333 |
14321.766667 |
14481.000000 |
60 |
-0.148876 |
-0.112394 |
-0.139850 |
0.442917 |
0.530778 |
31.846667 |
True |
20.0 |
35.0 |
31.846667 |
0.0 |
0.000000 |
0.000000 |
9 |
65 |
-0.244358 |
NaN |
NaN |
NaN |
| 2026-03-21 14:25:00+08:00 |
166 |
865 |
Ws_E14 |
0.557559 |
30 |
865.00 |
864.083333 |
866.00 |
864.250000 |
14349.128571 |
14348.000000 |
60 |
-0.130583 |
-0.113866 |
-0.104236 |
NaN |
-0.002176 |
-0.130583 |
True |
-55.0 |
-105.0 |
30.420000 |
0.0 |
0.000000 |
0.000000 |
25 |
909 |
-0.392089 |
NaN |
NaN |
NaN |