| 2026-03-20 08:15:00+08:00 |
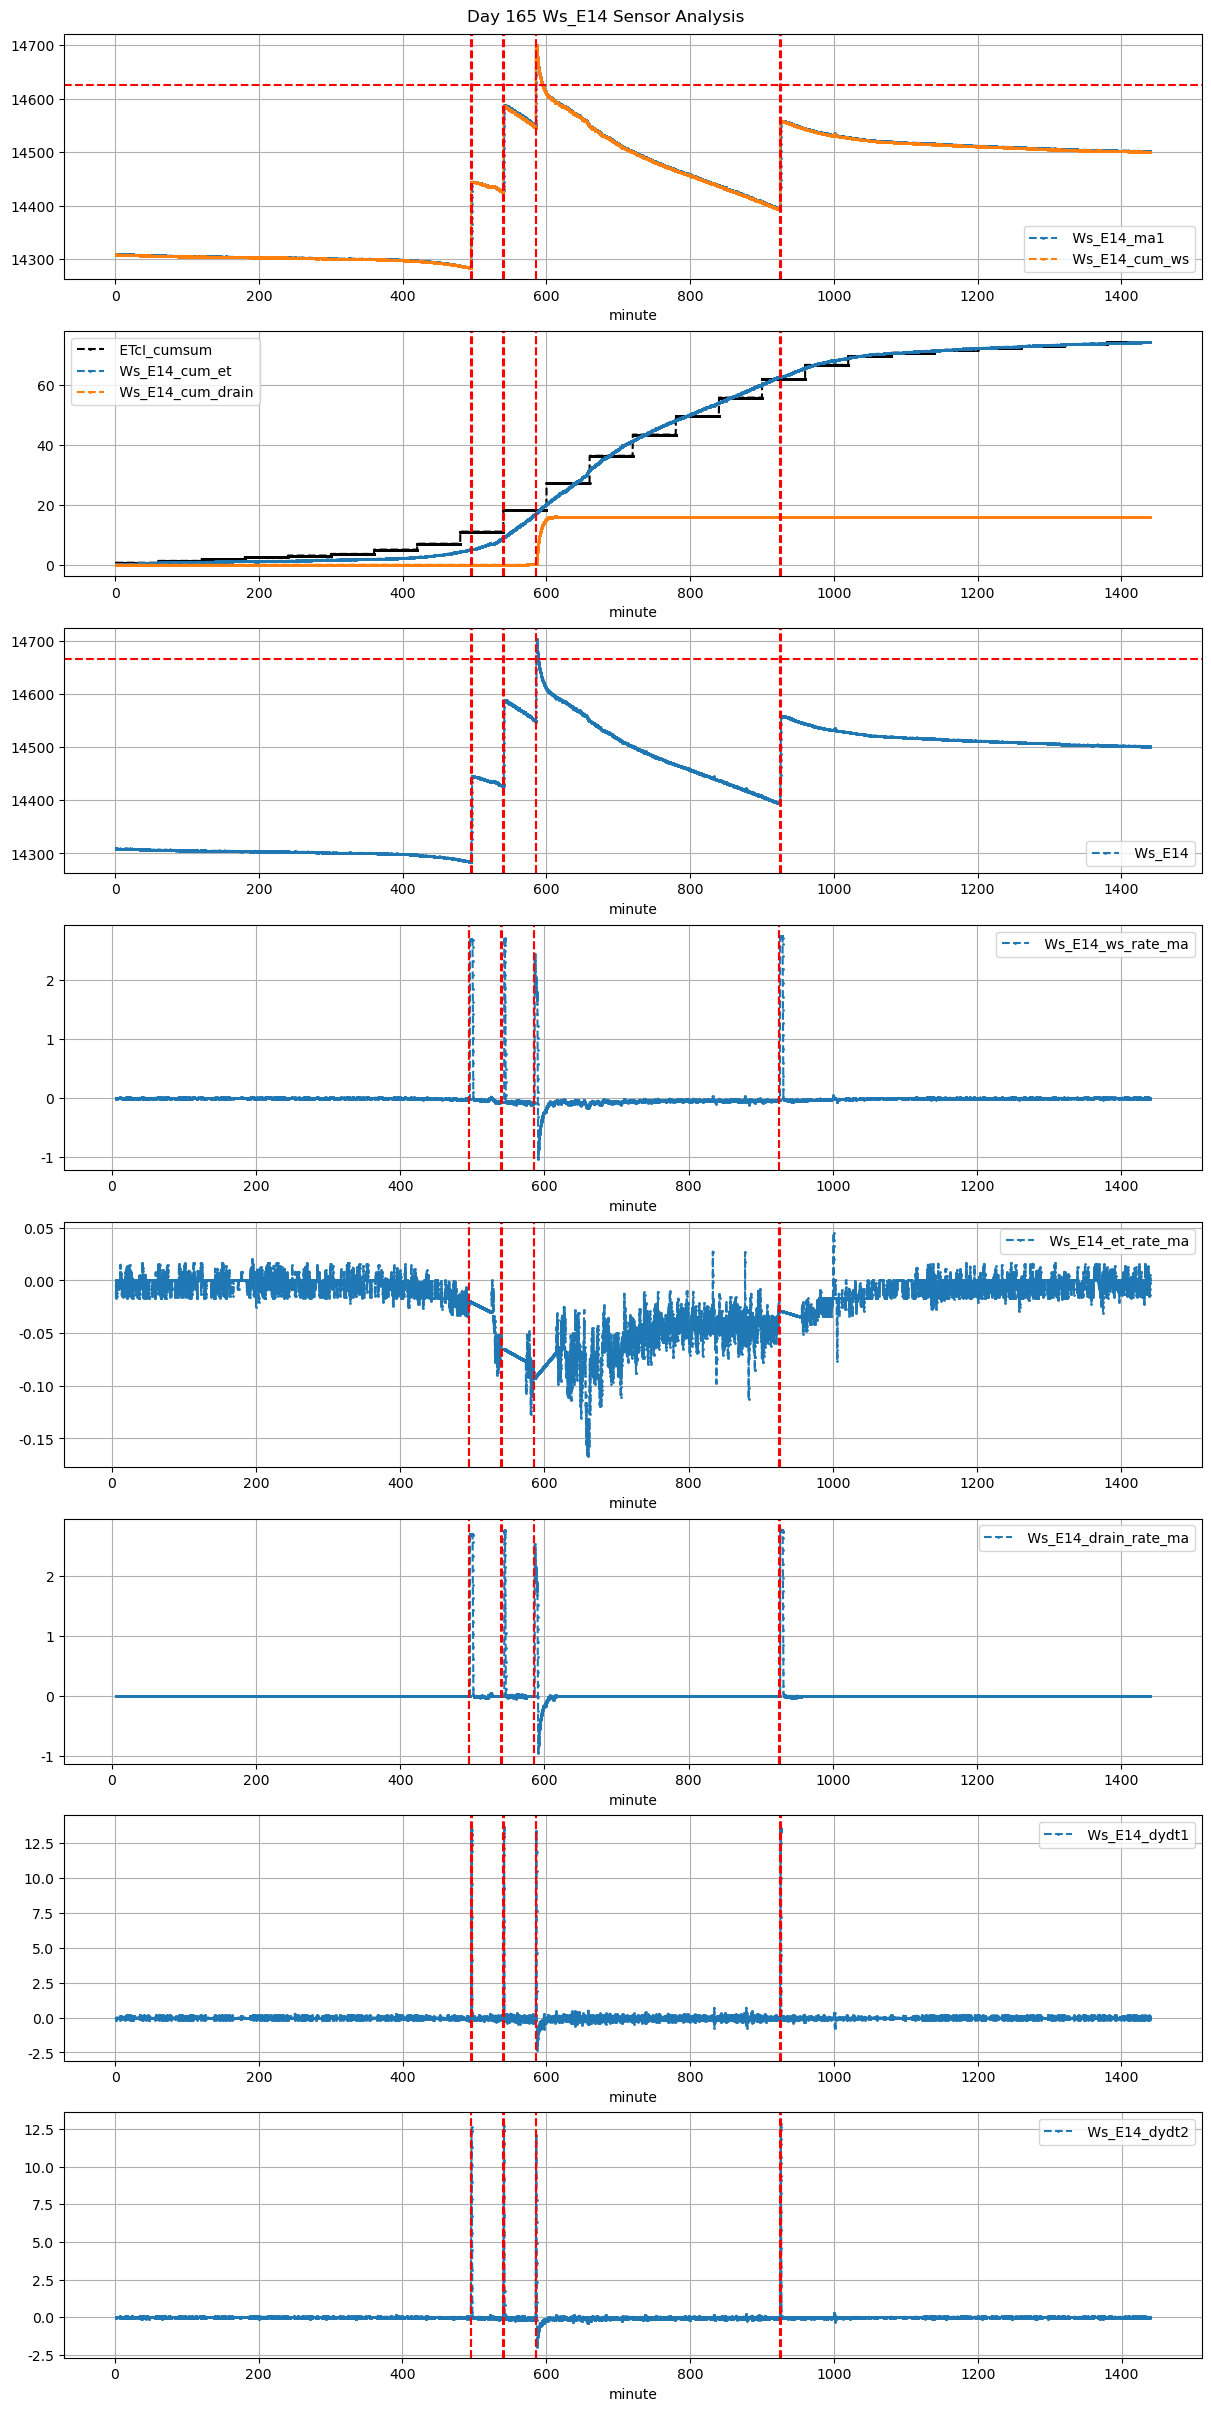
165 |
495 |
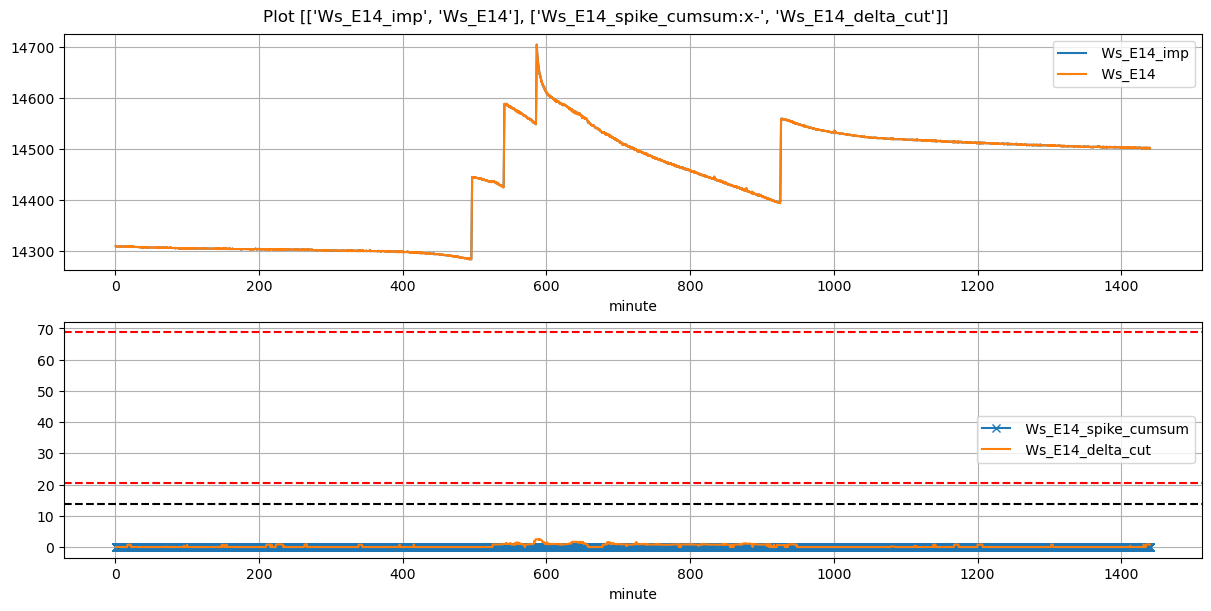
Ws_E14 |
0.383747 |
30 |
495.0 |
495.25 |
495.97 |
496.666667 |
14284.0 |
14445.0 |
58 |
-0.019860 |
-0.026227 |
-0.030324 |
0.456000 |
0.555172 |
32.20 |
True |
15.0 |
41.8 |
32.20 |
0.0 |
0.000000 |
0.000000 |
15 |
171 |
-0.142167 |
NaN |
NaN |
NaN |
| 2026-03-20 09:00:00+08:00 |
165 |
540 |
Ws_E14 |
0.383747 |
30 |
540.0 |
540.25 |
540.97 |
544.250000 |
14426.7 |
14588.0 |
58 |
-0.065274 |
-0.069815 |
-0.076597 |
0.317985 |
0.556207 |
32.26 |
True |
15.0 |
196.8 |
32.26 |
0.0 |
0.000000 |
0.000000 |
9 |
211 |
-0.243940 |
NaN |
NaN |
NaN |
| 2026-03-20 09:45:00+08:00 |
165 |
585 |
Ws_E14 |
0.383747 |
30 |
585.0 |
585.25 |
585.98 |
586.500000 |
14550.6 |
14704.0 |
59 |
-0.092255 |
-0.583542 |
-0.067917 |
0.454242 |
0.520000 |
30.68 |
True |
15.0 |
31.2 |
30.68 |
0.0 |
15.722301 |
15.722301 |
575 |
41 |
-1.129365 |
14625.388493 |
NaN |
NaN |
| 2026-03-20 15:25:00+08:00 |
165 |
925 |
Ws_E14 |
0.383747 |
30 |
925.0 |
925.25 |
925.98 |
926.833333 |
14394.5 |
14559.0 |
59 |
-0.041705 |
-0.028611 |
-0.034790 |
0.462055 |
0.557627 |
32.90 |
True |
15.0 |
51.2 |
32.90 |
0.0 |
0.000000 |
0.000000 |
20 |
596 |
-0.159796 |
NaN |
NaN |
NaN |