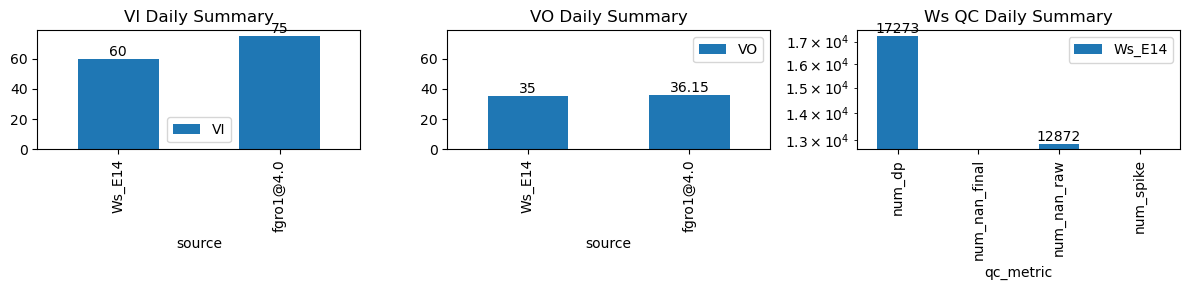
VI and VO Daily Summary
| ws_name | num_dp | num_nan_raw | num_nan_final | num_spike | cum_step_adj |
|---|---|---|---|---|---|
| Ws_E14 | 17,273 | 12,872 | 0 | 0 | 0.00 |
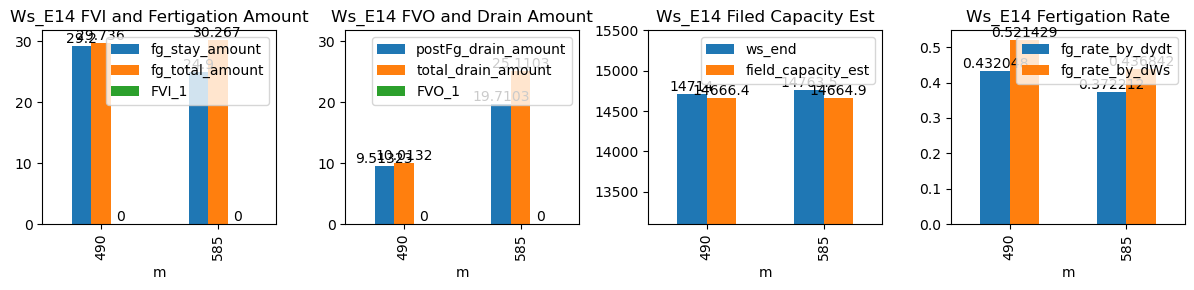
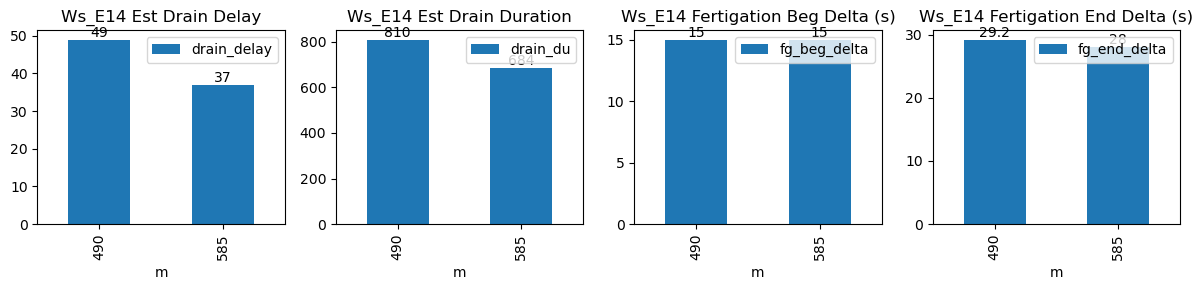
| ds | d | m | ws_name | prominence_cut | max_drain_du | fg_beg | fg_beg_est | fg_end | fg_end_est | ws_beg | ws_end | duc | pre_fg_et | post_fg_ws | post_drn_et | fg_rate_by_dydt | fg_rate_by_dWs | fg_stay_amount | enough_data | fg_beg_delta | fg_end_delta | fg_total_amount | fg_drain_amount | postFg_drain_amount | total_drain_amount | drain_du | drain_delay | drain_rate | field_capacity_est | FVI_1 | FVO_1 |
|---|---|---|---|---|---|---|---|---|---|---|---|---|---|---|---|---|---|---|---|---|---|---|---|---|---|---|---|---|---|---|---|
| 2026-03-19 08:10:00+08:00 | 164 | 490 | Ws_E14 | 0.470531 | 30 | 490.0 | 490.25 | 490.93 | 491.416667 | 14568.0 | 14714.0 | 56 | 0.000000 | -0.327269 | -0.018528 | 0.432048 | 0.521429 | 29.2 | True | 15.0 | 29.2 | 29.736 | 0.5 | 9.513226 | 10.013226 | 810 | 49 | -0.599115 | 14666.433869 | NaN | NaN |
| 2026-03-19 09:45:00+08:00 | 164 | 585 | Ws_E14 | 0.470531 | 30 | 585.0 | 585.25 | 585.95 | 586.416667 | 14639.0 | 14763.5 | 57 | -0.045833 | -0.688472 | -0.101405 | 0.372212 | 0.436842 | 24.9 | True | 15.0 | 28.0 | 30.267 | 5.4 | 19.710346 | 25.110346 | 684 | 37 | -1.601969 | 14664.948272 | NaN | NaN |