| 2026-03-18 08:16:20+08:00 |
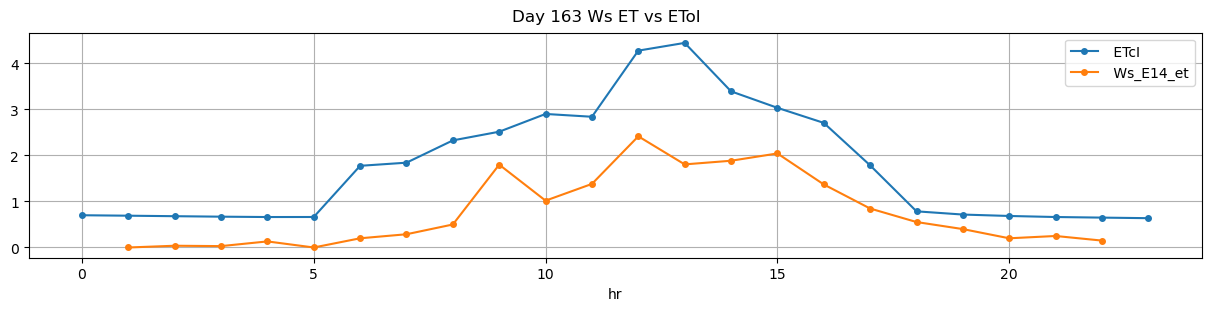
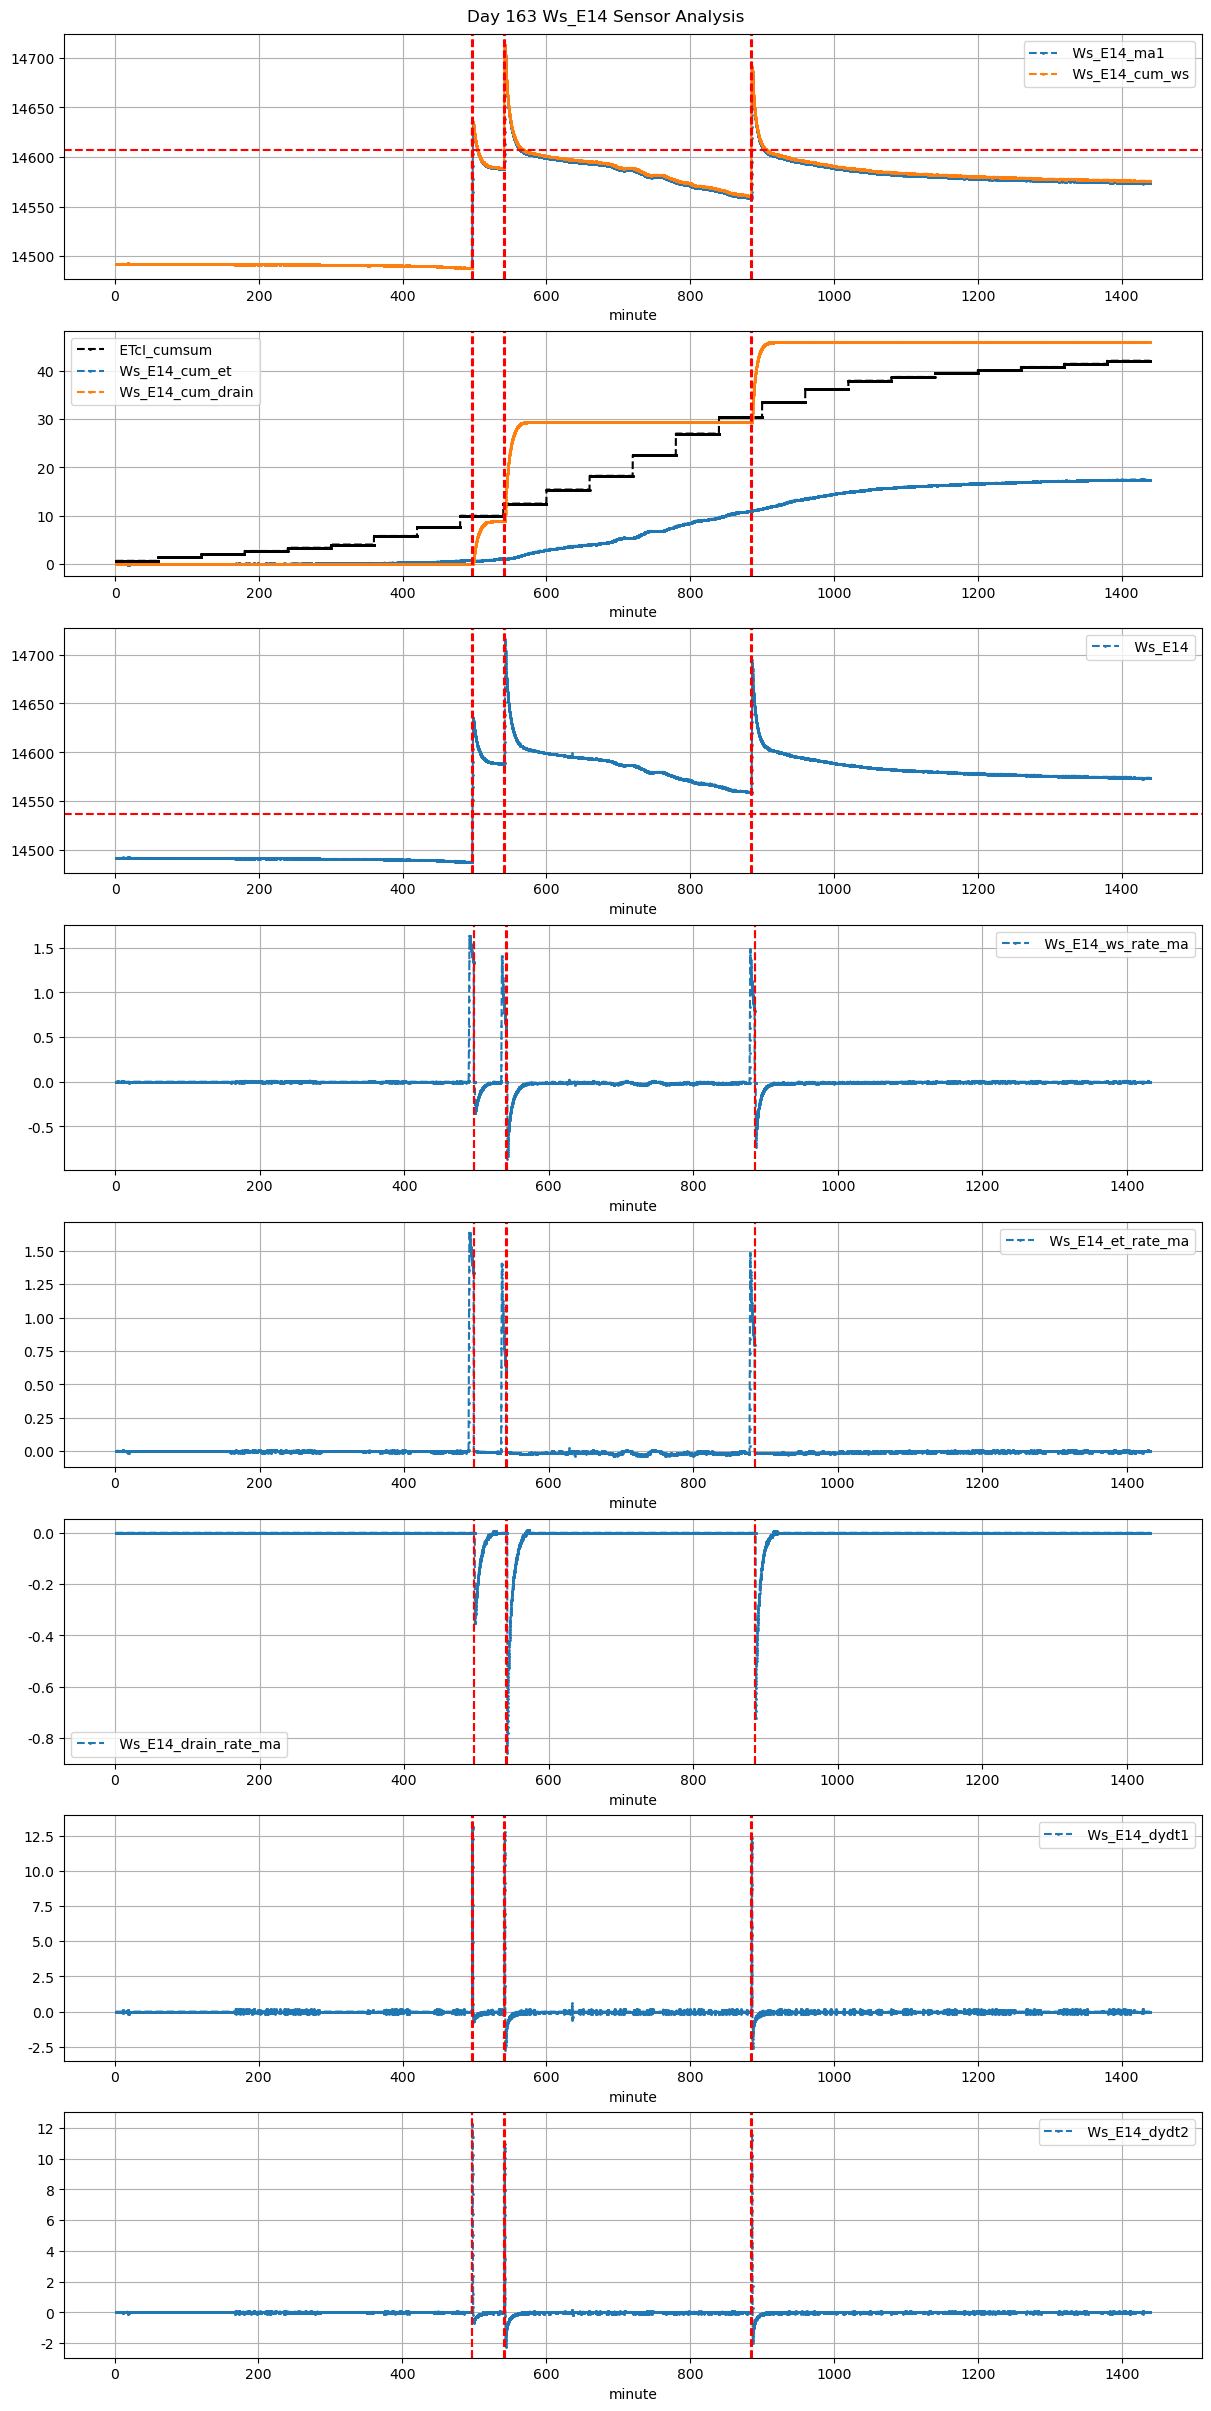
163 |
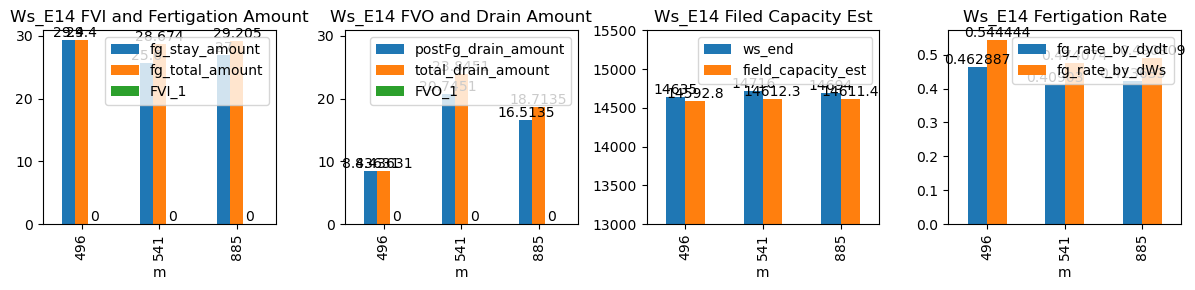
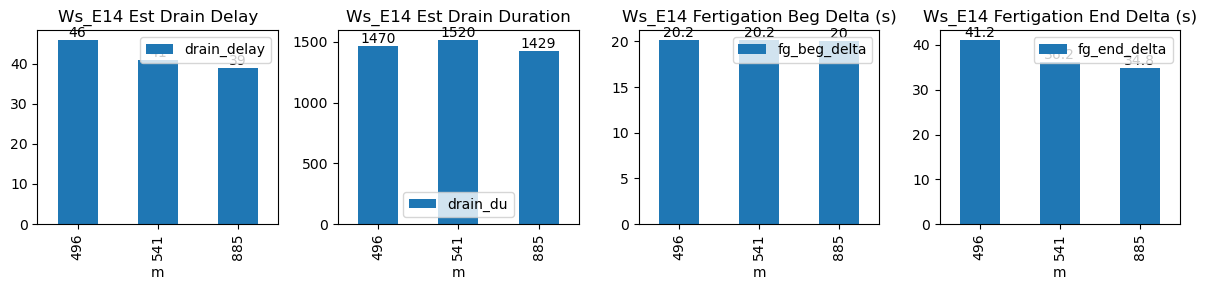
496 |
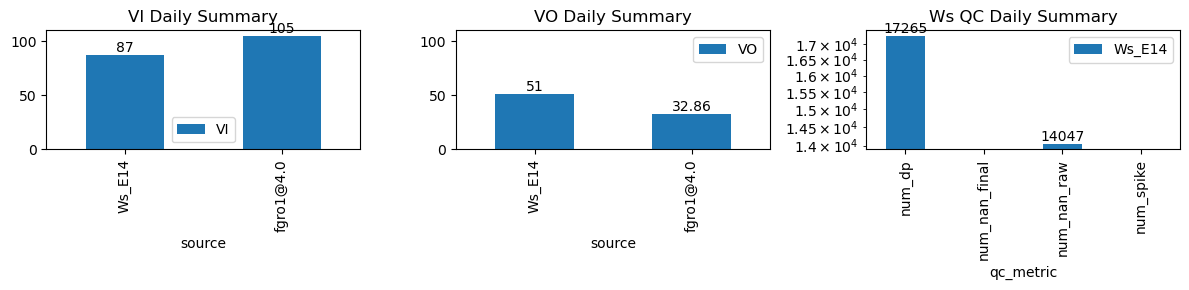
Ws_E14 |
0.498829 |
30 |
496.33 |
496.666667 |
497.23 |
497.750000 |
14488.0 |
14635.0 |
54 |
0.000000 |
-0.304664 |
-0.004319 |
0.462887 |
0.544444 |
29.4 |
True |
20.2 |
31.2 |
29.400 |
0.0 |
8.436314 |
8.436314 |
814 |
71 |
-0.499749 |
14592.818430 |
NaN |
NaN |
| 2026-03-18 09:01:20+08:00 |
163 |
541 |
Ws_E14 |
0.498829 |
30 |
541.33 |
541.666667 |
542.23 |
542.750000 |
14588.0 |
14716.0 |
54 |
-0.005770 |
-0.623194 |
-0.022361 |
0.409030 |
0.474074 |
25.6 |
True |
20.2 |
31.2 |
28.674 |
3.1 |
20.745121 |
23.845121 |
945 |
41 |
-1.293460 |
14612.274393 |
NaN |
NaN |
| 2026-03-18 14:45:00+08:00 |
163 |
885 |
Ws_E14 |
0.498829 |
30 |
885.00 |
885.333333 |
885.92 |
886.416667 |
14559.0 |
14694.0 |
55 |
-0.012994 |
-0.522333 |
-0.015489 |
0.423633 |
0.490909 |
27.0 |
True |
20.0 |
29.8 |
29.205 |
2.2 |
16.513492 |
18.713492 |
774 |
39 |
-1.070231 |
14611.432540 |
NaN |
NaN |