VI and VO Daily Summary
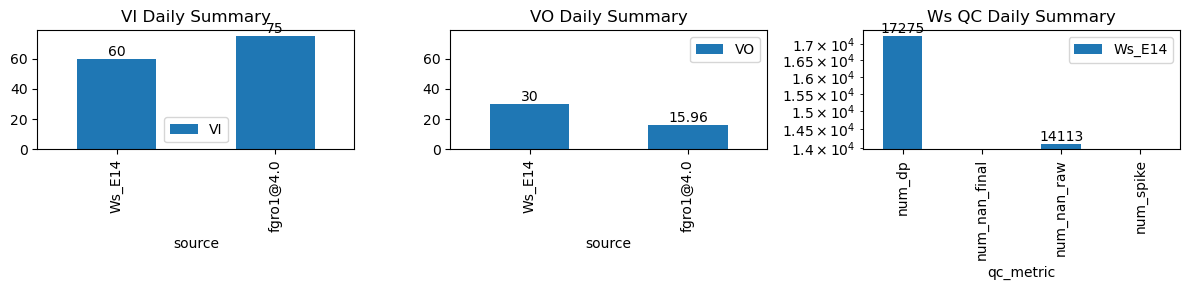
| ws_name | num_dp | num_nan_raw | num_nan_final | num_spike | cum_step_adj |
|---|---|---|---|---|---|
| Ws_E14 | 17,275 | 14,113 | 0 | 0 | 0.00 |
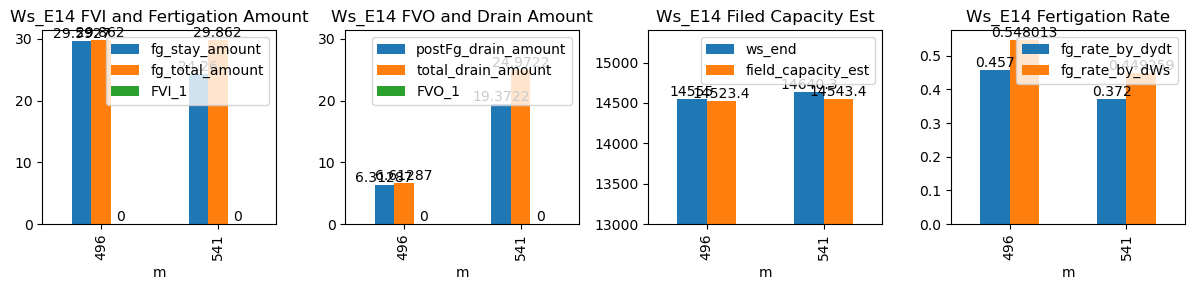
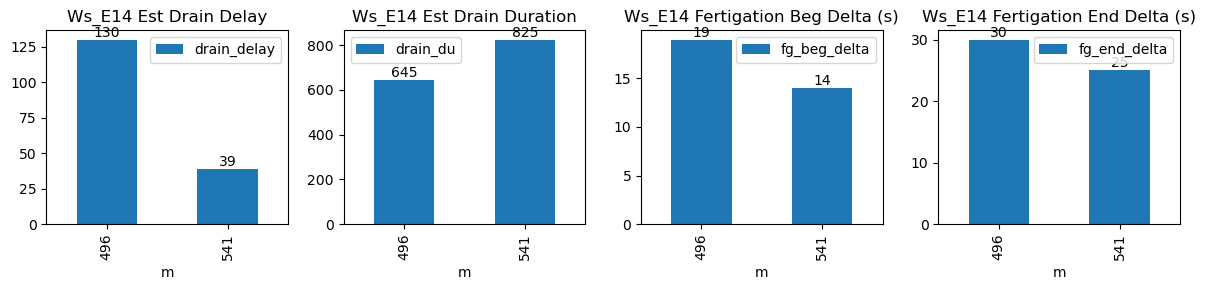
| ds | d | m | ws_name | prominence_cut | max_drain_du | fg_beg | fg_beg_est | fg_end | fg_end_est | ws_beg | ws_end | duc | pre_fg_et | post_fg_ws | post_drn_et | fg_rate_by_dydt | fg_rate_by_dWs | fg_stay_amount | enough_data | fg_beg_delta | fg_end_delta | fg_total_amount | fg_drain_amount | postFg_drain_amount | total_drain_amount | drain_du | drain_delay | drain_rate | field_capacity_est | FVI_1 | FVO_1 |
|---|---|---|---|---|---|---|---|---|---|---|---|---|---|---|---|---|---|---|---|---|---|---|---|---|---|---|---|---|---|---|---|
| 2026-03-17 08:16:21+08:00 | 162 | 496 | Ws_E14 | 0.368672 | 30 | 496.35 | 496.666667 | 497.25 | 497.750000 | 14407.000000 | 14555.0 | 54 | -0.003554 | -0.241218 | -0.012770 | 0.467752 | 0.548148 | 29.600000 | True | 19.0 | 30.0 | 29.916 | 0.3 | 5.874948 | 6.174948 | 645 | 130 | -0.368752 | 14525.625261 | NaN | NaN |
| 2026-03-17 09:01:21+08:00 | 162 | 541 | Ws_E14 | 0.368672 | 30 | 541.35 | 541.583333 | 542.25 | 542.666667 | 14518.704762 | 14645.0 | 54 | -0.007253 | -0.602056 | -0.026806 | 0.382200 | 0.467760 | 25.259048 | True | 14.0 | 25.0 | 29.916 | 4.7 | 19.386481 | 24.086481 | 825 | 39 | -1.211805 | 14548.067597 | NaN | NaN |