| 2026-03-05 09:16:28+08:00 |
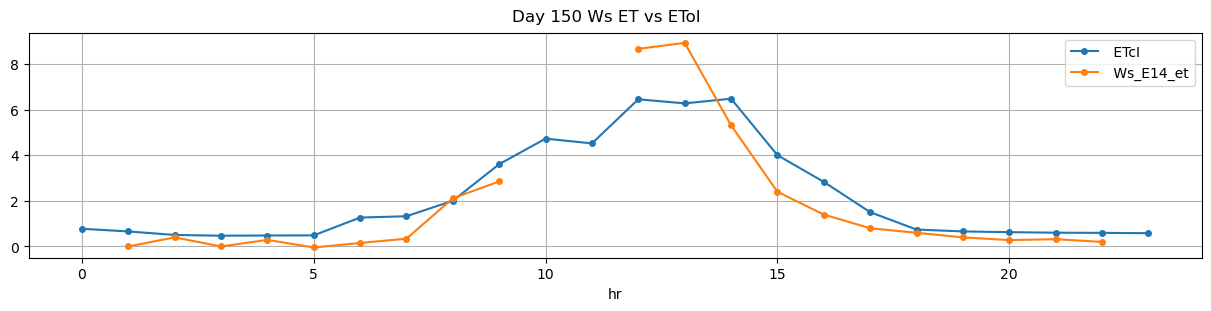
150 |
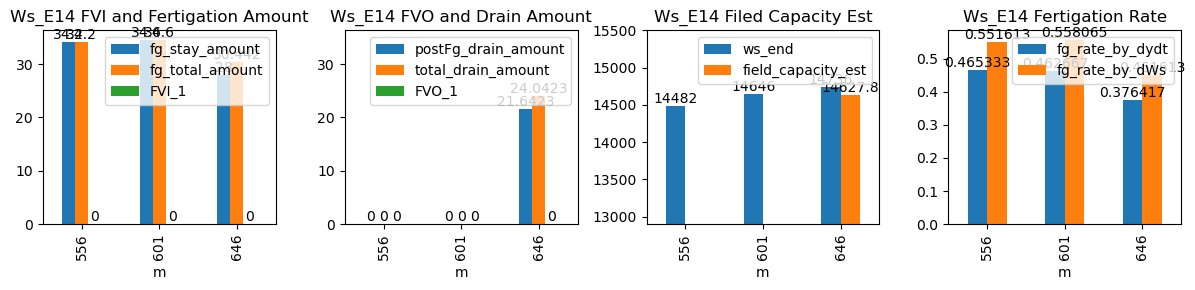
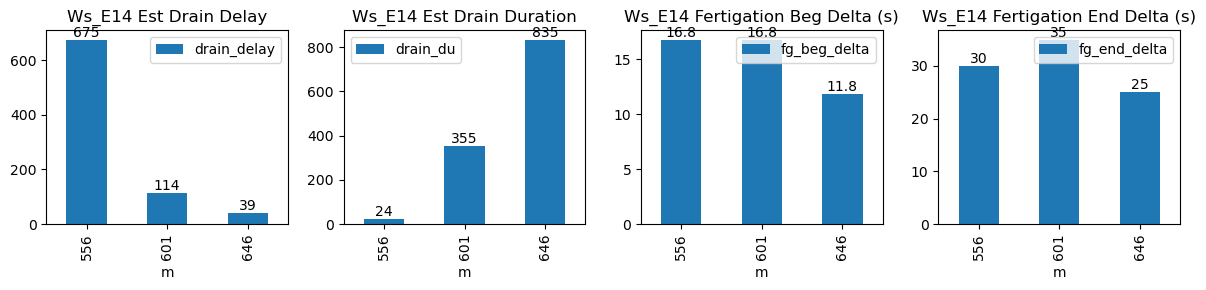
556 |
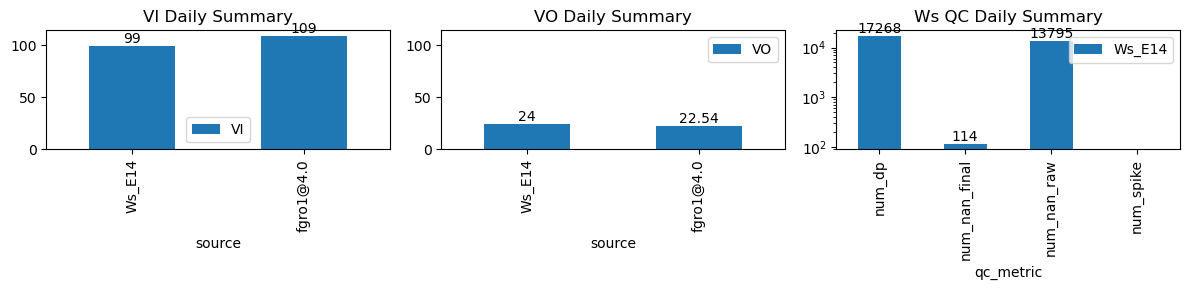
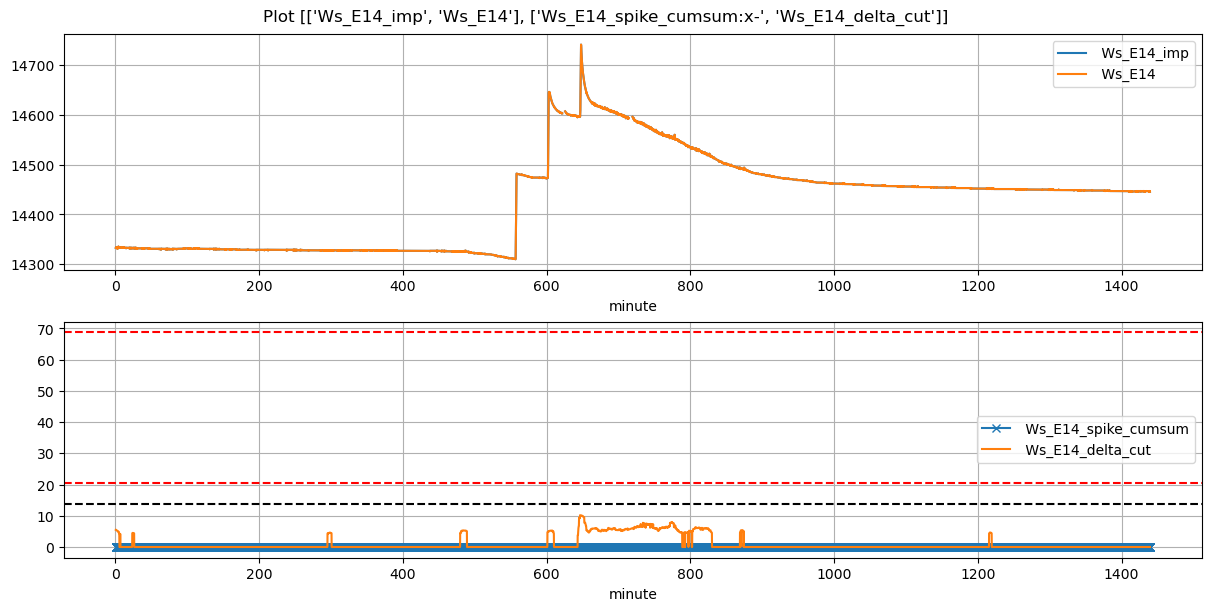
Ws_E14 |
0.467643 |
30 |
556.47 |
556.750000 |
557.5 |
558.000000 |
14311.0 |
14482.0 |
62 |
-0.016542 |
-0.025000 |
-0.000972 |
0.473333 |
0.551613 |
34.20 |
True |
16.8 |
30.0 |
34.200 |
0.0 |
0.000000 |
0.000000 |
24 |
675 |
-0.144257 |
NaN |
NaN |
NaN |
| 2026-03-05 10:01:28+08:00 |
150 |
601 |
Ws_E14 |
0.467643 |
30 |
601.47 |
601.750000 |
602.5 |
603.083333 |
14472.9 |
14646.0 |
62 |
-0.010417 |
-0.327361 |
-0.033681 |
0.480333 |
0.558387 |
34.62 |
True |
16.8 |
35.0 |
34.620 |
0.0 |
4.330208 |
4.330208 |
355 |
114 |
-0.614729 |
NaN |
NaN |
NaN |
| 2026-03-05 10:46:28+08:00 |
150 |
646 |
Ws_E14 |
0.467643 |
30 |
646.47 |
646.666667 |
647.5 |
647.916667 |
14596.0 |
14741.0 |
62 |
-0.034861 |
-0.765042 |
-0.041111 |
0.377083 |
0.467742 |
29.00 |
True |
11.8 |
25.0 |
30.442 |
1.4 |
21.473049 |
22.873049 |
835 |
39 |
-1.739856 |
14633.634757 |
NaN |
NaN |