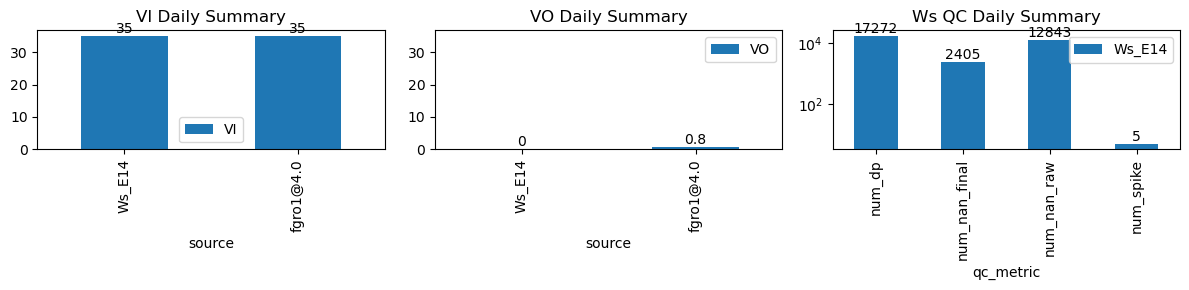
VI and VO Daily Summary
| ws_name | num_dp | num_nan_raw | num_nan_final | num_spike | cum_step_adj |
|---|---|---|---|---|---|
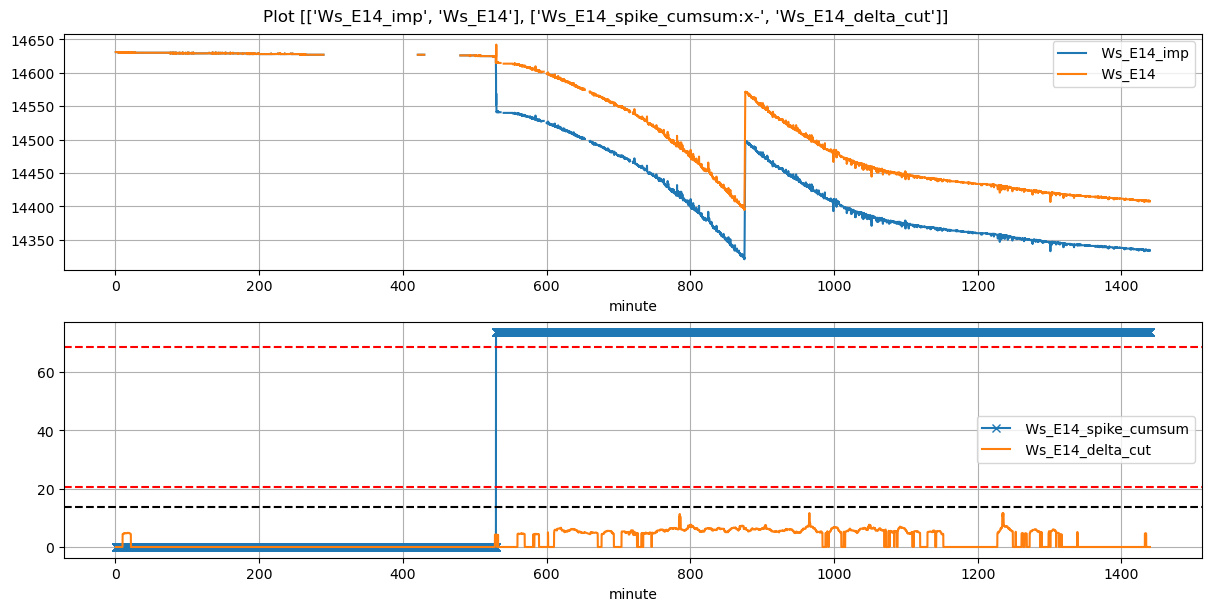
| Ws_E14 | 17,272 | 12,843 | 2,405 | 5 | 73.67 |
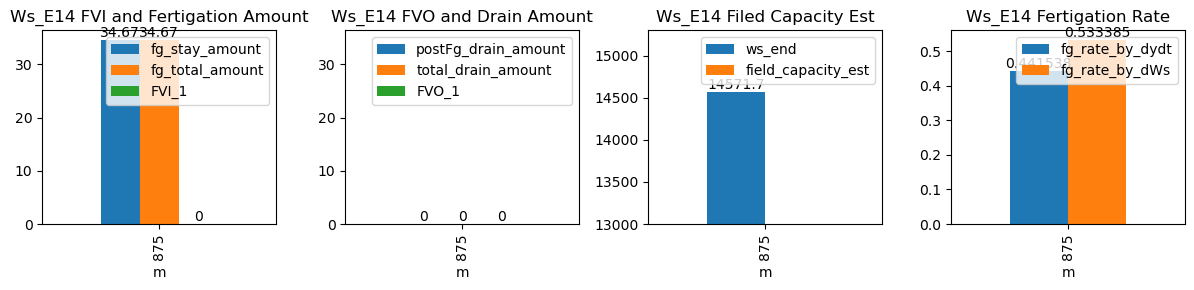
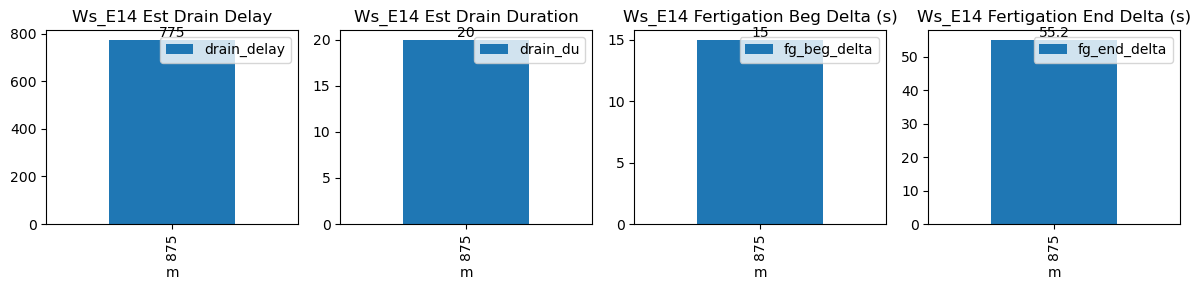
| ds | d | m | ws_name | prominence_cut | max_drain_du | fg_beg | fg_beg_est | fg_end | fg_end_est | ws_beg | ws_end | duc | pre_fg_et | post_fg_ws | post_drn_et | fg_rate_by_dydt | fg_rate_by_dWs | fg_stay_amount | enough_data | fg_beg_delta | fg_end_delta | fg_total_amount | fg_drain_amount | postFg_drain_amount | total_drain_amount | drain_du | drain_delay | drain_rate | field_capacity_est | FVI_1 | FVO_1 |
|---|---|---|---|---|---|---|---|---|---|---|---|---|---|---|---|---|---|---|---|---|---|---|---|---|---|---|---|---|---|---|---|
| 2026-03-04 14:35:00+08:00 | 149 | 875 | Ws_E14 | 0.348692 | 30 | 875.0 | 875.25 | 876.08 | 876.916667 | 14398.316667 | 14571.666667 | 65 | -0.085122 | -0.080093 | -0.067766 | 0.441538 | 0.533385 | 34.67 | True | 15.0 | 50.2 | 34.67 | 0.0 | 0 | 0.0 | 20 | 515 | -0.383114 | NaN | NaN | NaN |